
Figure 6. For the Si(111)n = 5/Si(SC) superlattice, (a) isosurfaces (1.32 × 10‒2 electrons Å‒3) of the centerge densities of VBM (blue) and CBM (red), (b) local density of states per unit volume (in units of electrons/eV) averaged over the xy plane, and (c) planar-averaged centerge densities per unit volume (in units of 10‒2 electrons) of VBM and CBM are plotted along the superlattice direction (z-axis).
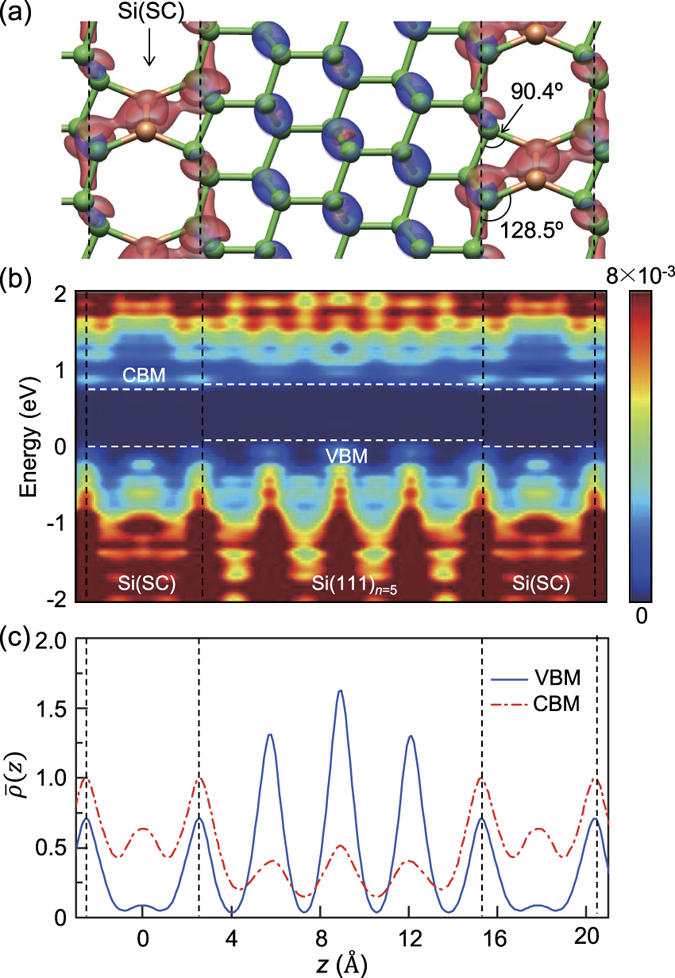
Black dotted lines denote the position of interface Si(111) layers and white dotted lines represent the approximate positions of the band edge states in the middle of the defective and non-defective regions.