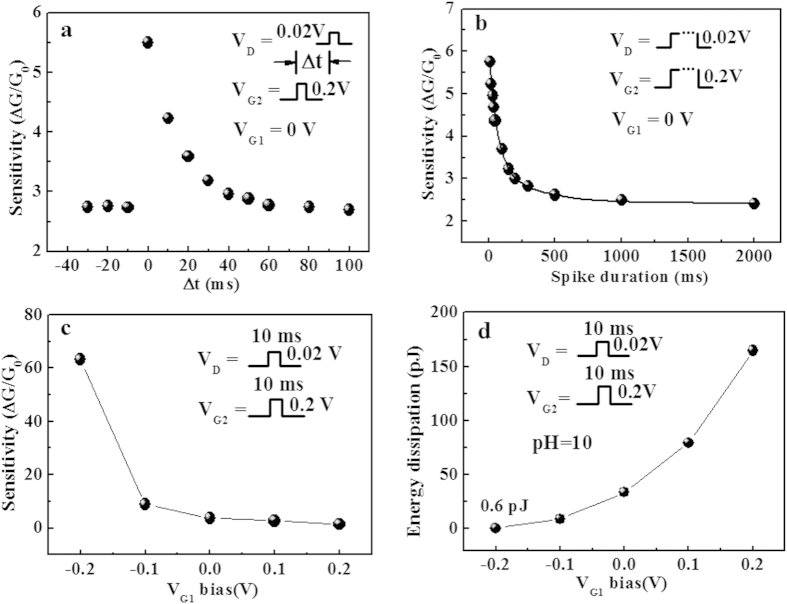
Figure 6. Influences of measuring parameters on the spike sensing performance.
(a) The sensitivity as a function of the inter-spike interval between VD and VG2 for asynchronous spiking sensing test. (b) The changes in sensitivity with spike duration. The solid line is the fitted curve. (c) The changes in sensitivity and energy dissipation (pH = 10) with various VG2 spike amplitude for synchronous spiking sensing test. (d) The changes in sensitivity and energy dissipation (pH = 10) against various VG1 bias.

