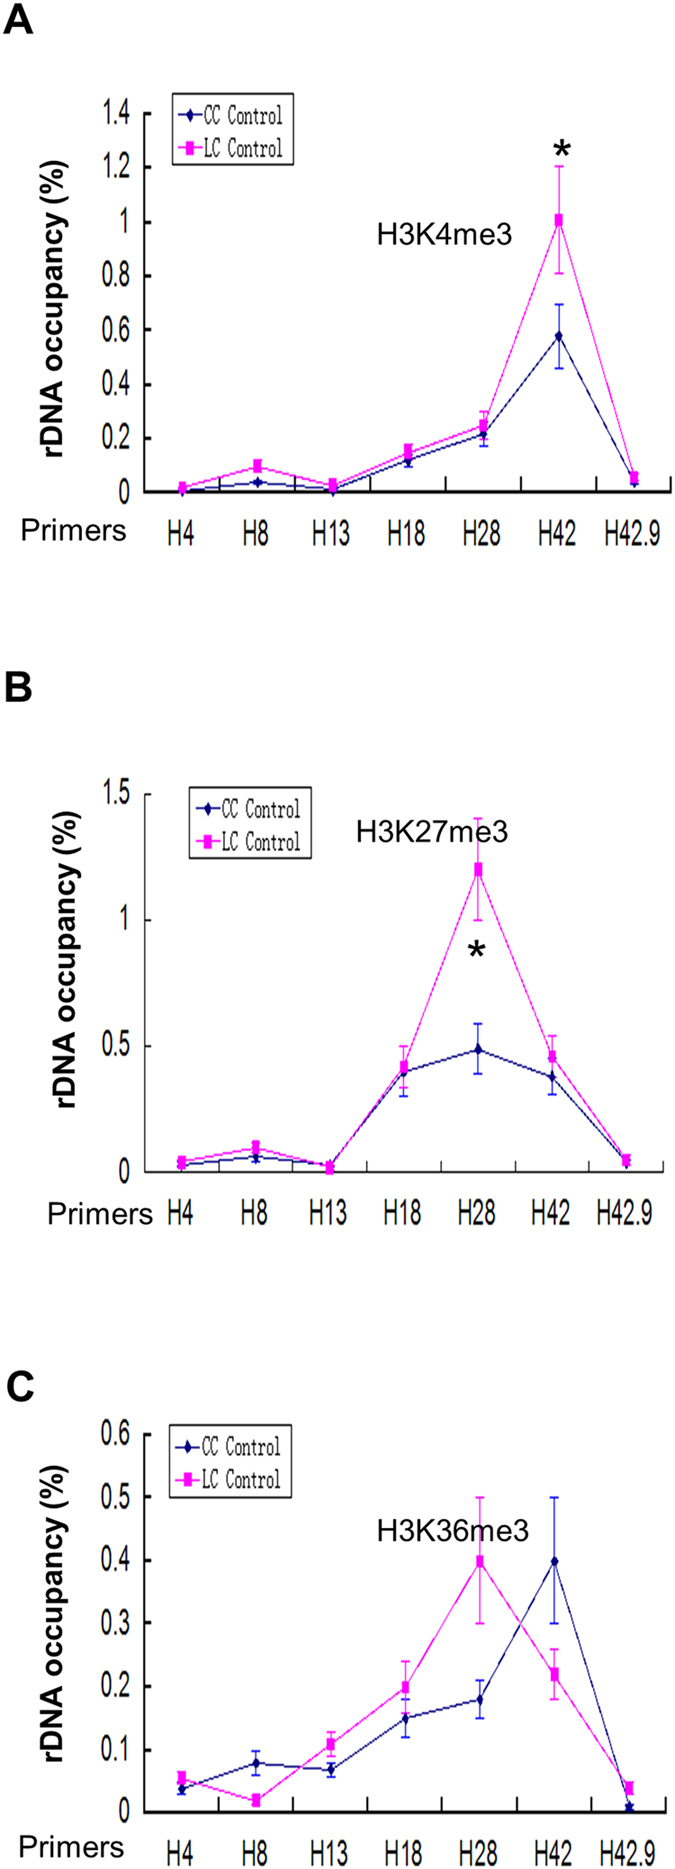
Figure 4. ChIP-QPCR for histone modifications (H3K4me3, H3K36me3 and H3K27ac) in human liver cancer cell (LC control) and normal liver cell (CC control).

(A) Enrichment of H3K4me3 on rDNA analyzed by ChIP-QPCR. Chromatin from HepG2 cells was cross-linked and immunoprecipitated with H3K4me3 antibody, DNA was analyzed by QPCR with different sets of primers indicated in (A). The percentage of DNA associated with anti-H3K4me3 antibody was calculated relative to the DNA from ChIP input. Values are represented by means ± SD from three independent ChIP experiments, each experiment was tested by at least three independent QPCR reactions. (B) Enrichment of H3K27me3 on rDNA analyzed by ChIP-QPCR. Chromatin from HepG2 cells was cross-linked and immunoprecipitated with H3K27me3 antibody, DNA was analyzed by QPCR with different sets of primers indicated in (A). The percentage of DNA associated with anti-H3K27me3 antibody was calculated relative to the DNA from ChIP input. Values are represented by means ± SD from three independent ChIP experiments, each experiment was tested by at least three independent QPCR reactions. Student’s t-test was performed between human liver cancer cell (LC Control) and normal liver cell (CC Control). (C) Enrichment of H3K36me3 on rDNA analyzed by ChIP-QPCR. Chromatin from HepG2 cells was cross-linked and immunoprecipitated with H3K27me3 antibody, DNA was analyzed by QPCR with different sets of primers indicated in (A). The percentage of DNA associated with anti-H3K36me3 antibody was calculated relative to the DNA from ChIP input. Values are represented by means ± SD derived from three independent ChIP experiments, each experiment was tested by at least three independent QPCR reactions. Student’s t-test was performed between human liver cancer cell (LC Control) and normal liver cell (CC Control).
