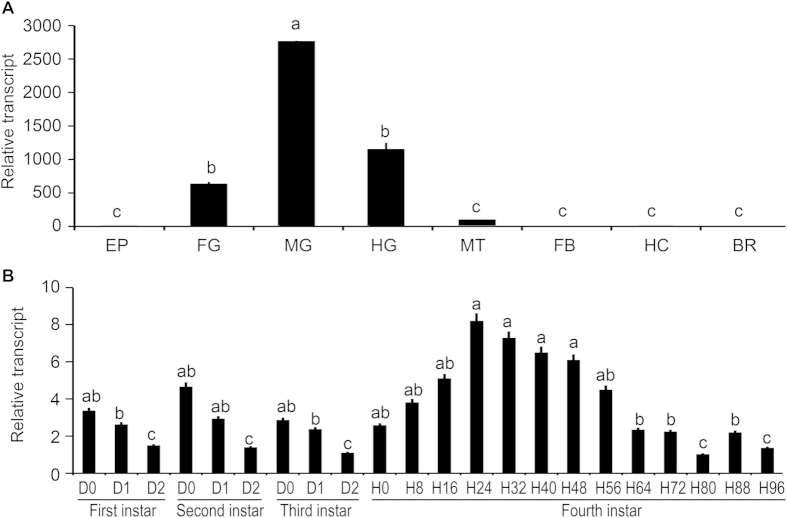
Figure 1. Tissue (A) and temporal (B) expression patterns of LdNAT1.
For tissue expression analysis, cDNA templates are derived from epidermis (EP), foregut (FG), midgut (MG), hindgut (HG), Malpighian tubules (MT), fat body (FB), hemocytes (HE) and brain-corpora cardiaca-corpora allata complex (BR) of the day 1 fourth-instar larvae. For temporal expression analysis, cDNA templates are derived from the first, second, third larval instars at the interval of one day, and from fourth larval instars at the interval of eight hours (D0/H0 indicated newly ecdysed larvae). For each sample, 3 independent pools of 5–30 individuals are measured in technical triplicate using qPCR. The bars represent 2-ΔΔCt method (±SE) normalized to the geometrical mean of housekeeping gene expression. Different letters indicate significant difference at P value < 0.05.

