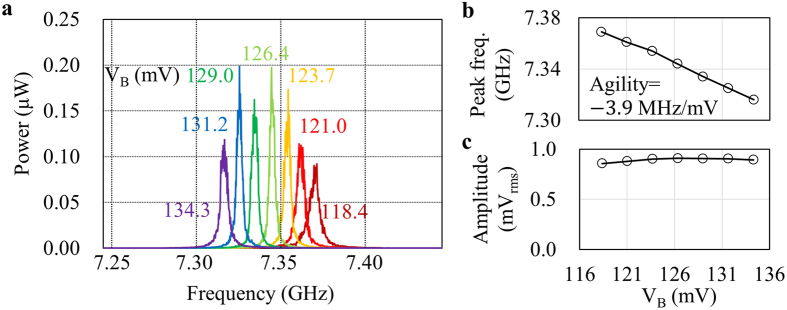
Figure 2. Free running characteristics of the STO used in this work.
(a) Spectra of the RF signal generated by the STO under different bias voltages. These spectra are observed by a spectrum analyzer with a frequency span of 200 MHz and resolution bandwidth of 1 MHz. (b) Peak frequency and (c) amplitude as a function of bias voltage. Agility is the slope of the frequency around the nominal bias point of VB = 126.4 mV.

