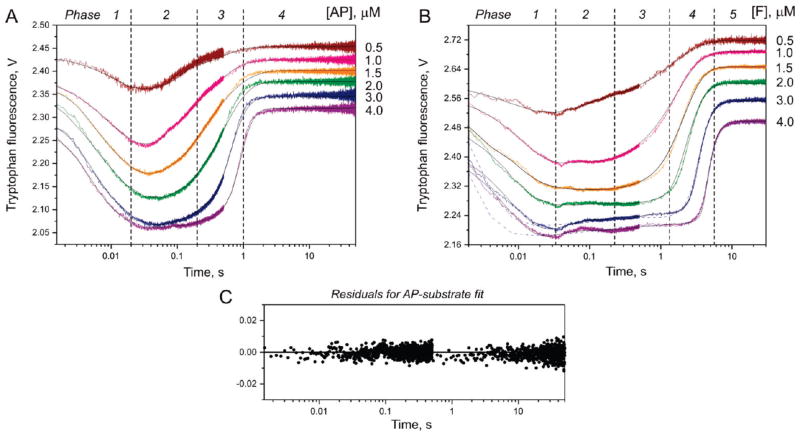
Figure 2.
Time-dependent fluorescence change associated with the cleavage of AP-substrate (A) and F-substrate (B) by APE1. The fluorescence traces are distributed along the signal axis for better visualization. The final concentrationofAPE1 is1.5 μM. Jagged traces represent experimental data; smooth curves are theoretically fitted. Blue dashed curves (B) represent the results of fitting of the experimental data to Scheme 5 (23). Dashed drop lines approximately correspond to different stages of kinetic Scheme 1. (C) Representative graph of the residuals for fitting of the experimental data (3.0 μM substrate).

