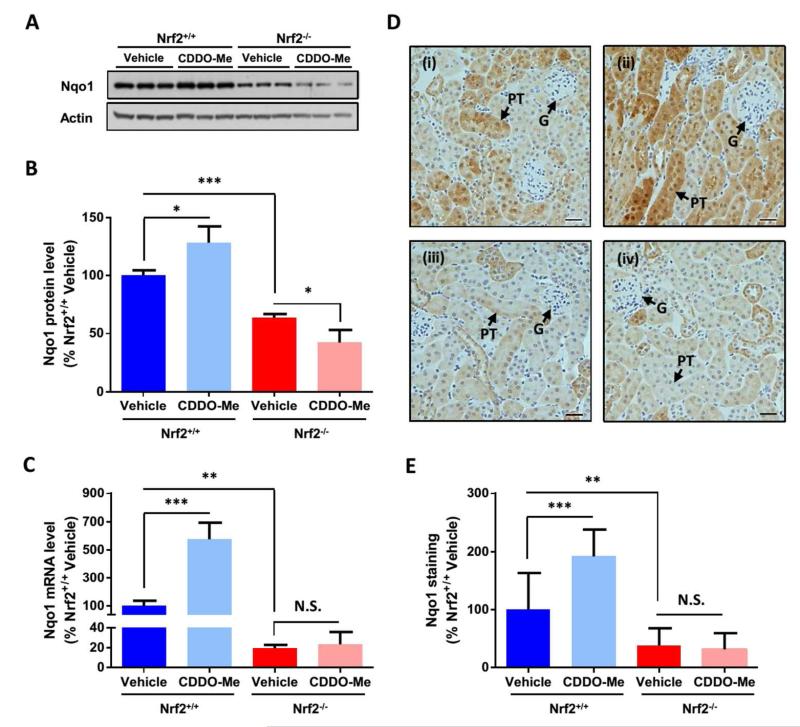
Fig. 1. Genetic and pharmacological modulation of Nrf2 in the mouse kidney.
Mice of the indicated genotype were given a single i.p. injection of vehicle (DMSO) or CDDO-Me (3 mg/kg) and, 24 h later, Nqo1 levels were determined by (A-B) immunoblotting, (C) qPCR and (D-E) immunohistochemical analysis of whole kidney tissue. (B) Nqo1 band intensities were quantified by densitometry and normalized against those of β-actin. (C) Nqo1 mRNA levels were normalized to those of Ppia. (D-E) Nqo1 expression levels in the cortex of Nrf2+/+ mice treated with (i) DMSO or (ii) CDDO-Me, or Nrf2−/− mice treated with (iii) DMSO or (iv) CDDO-Me. G, glomerulus; PT, proximal tubule. Scale bars represent 50 μm. Data represent mean + S.D. of n=3 (A-C) or n=5 (D-E) animals per group. Statistical analysis was performed with an unpaired t test; *, P≤0.05; **, P≤0.01; ***, P≤0.001; N.S., non-significant.

