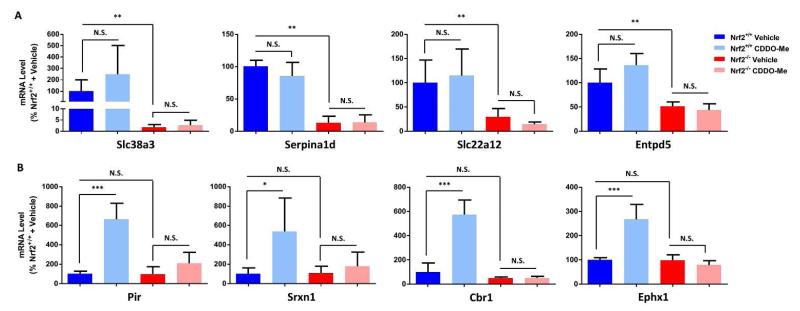
Fig. 3. Genes sensitive to genetic inhibition or pharmacological induction of Nrf2 in the mouse kidney.
qPCR validation of genes that were shown to be (A) significantly downregulated in the kidneys of Nrf2−/− mice, or (B) significantly upregulated in the kidneys of Nrf2+/+ mice treated with CDDO-Me. Gene expression levels are normalized to those of Ppia. Data represent mean + S.D. of n=5 animals per group. Statistical analysis of qPCR data was performed with an unpaired t test or Mann-Whitney test *, P≤0.05; **, P≤0.01; ***, P≤0.001; N.S., non-significant.

