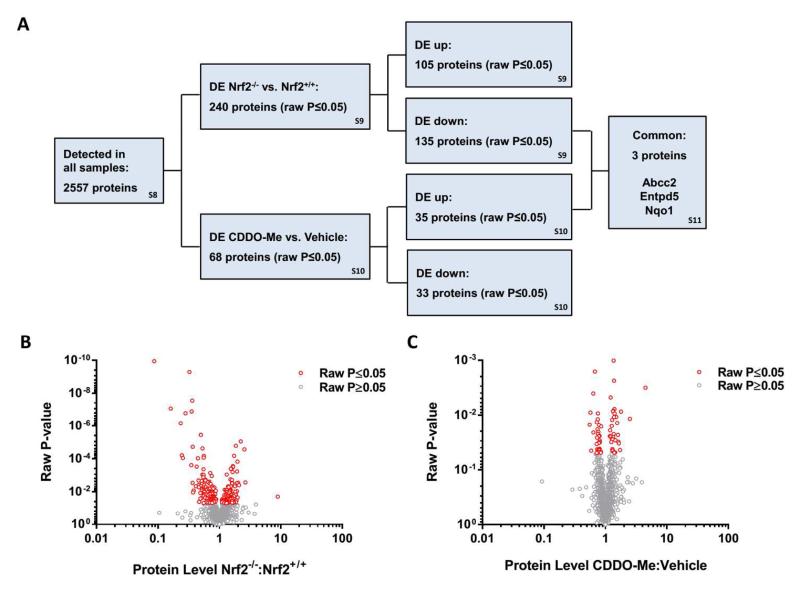
Fig. 5. Definition of the Nrf2-regulated renal proteome.
iTRAQ analysis was performed on kidney tissue from Nrf2+/+ or Nrf2−/− mice treated with vehicle (DMSO) or CDDO-Me for 24 h. (A) Overview of iTRAQ findings. DE; differentially expressed. The relevant supplementary tables are indicated in the boxes. (B-C) Volcano plots depicting differentially expressed proteins in the kidneys of (B) Nrf2−/− mice, compared with Nrf2+/+ counterparts, and (C) Nrf2+/+ mice treated with CDDO-Me, compared to vehicle. Each point represents a single protein, with those shaded red found to be significantly different (raw P-value) between groups.

