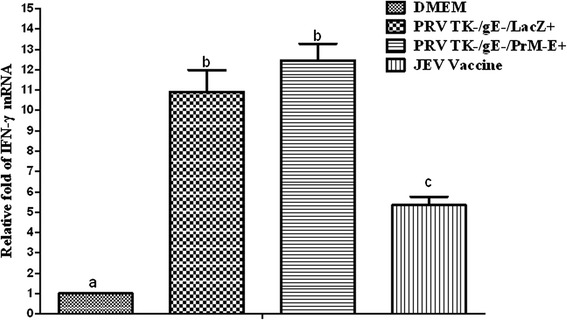
Fig. 5.

Relative IFN-γ gene expression in mice. The level of IFN-γ per group in serum samples of mice. Data represent the mean ± SEM. Different letters indicate a statistically significant difference between the different experimental groups (P < 0.05). Different letters (a, b, c) indicate a statistically significant difference between the different experimental groups (P < 0.05)
