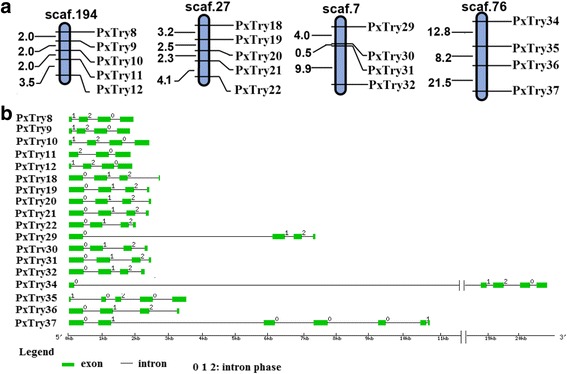
Fig. 1.

Scaffold localization and gene structure of P. xylostella trypsin genes. (a) The four scaffolds with ≥ four trypsin genes. Genes names and the distance of two adjacent genes (kilobases, kb) are showed on the right and left of the bar, respectively. Scaffold numbers are presented at the top of each bar. (b) Gene structure of the P. xylostella trypsins located on the four scaffolds was shown in Fig. 1a. Values (0, 1, and 2) above each of the black lines indicate the intron phase. The scale line at the bottom shows the length of each gene
