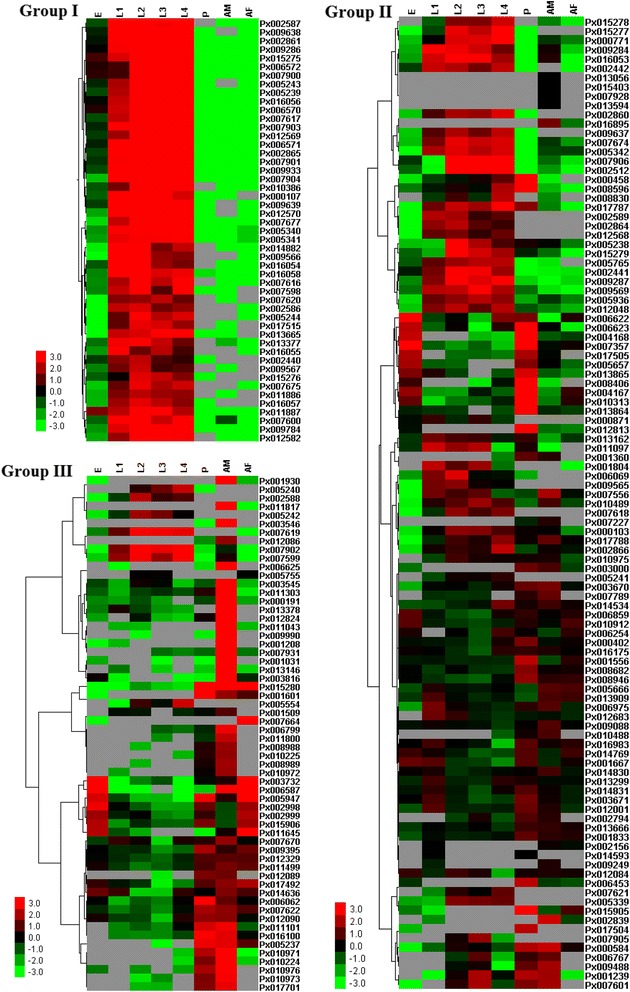
Fig. 6.

Expression profiling of the P. xylostella SP and SPH genes across different developmental stages. The log2 RPKM values are presented by bar colors where the darker red represents higher expression values, the darker green represents lower expression values, and the gray represents missing values. E, eggs; L1, 1st-instar larvae; L2, 2nd-instar larvae; L3, 3rd-instar larvae; L4, 4th-instar larvae; P, pupae; AM, adult males; AF, adult females. The RPKM values are given in the Additional file 10: Table S3
