
Fig. 6.
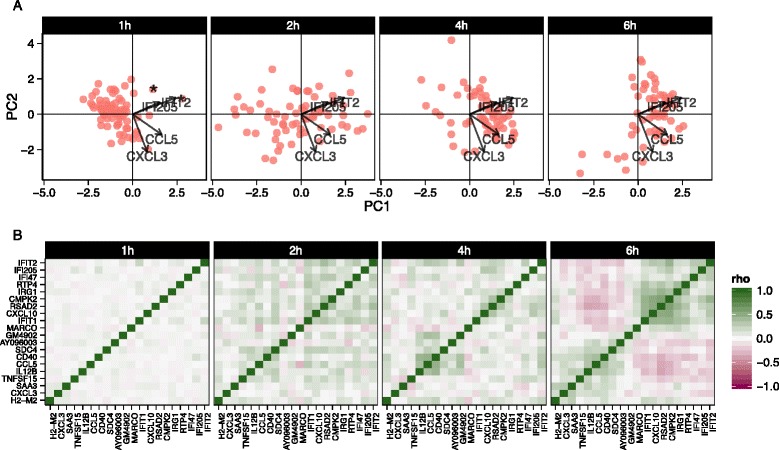
Principal components analysis biplot of model residuals (a) and gene–gene correlation (Pearson’s rho) of model residuals (b) by time point for lipopolysaccharide-induced myeloid dendritic cells (mDC data set) using 20 genes with the largest log-fold changes, given significant (false discovery rate q < 0.01) marginal changes in expression. Principle component 1 (PC1) is correlated with change over time. The two “early marcher” cells are highlighted by an asterisk at the 1 h time point. Correlation structure in the residuals is increasingly evident over time and can be clearly observed at the 6 h time point compared to the earlier time points