
Fig. 3.
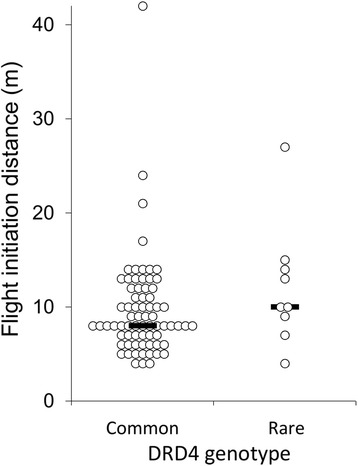
Flight initiation distances of black swans from the urban site according to DRD4 genotype. Dots represent flight initiation distances for individual swans and bars represent median values
Official websites use .gov
A
.gov website belongs to an official
government organization in the United States.
Secure .gov websites use HTTPS
A lock (
) or https:// means you've safely
connected to the .gov website. Share sensitive
information only on official, secure websites.
Flight initiation distances of black swans from the urban site according to DRD4 genotype. Dots represent flight initiation distances for individual swans and bars represent median values