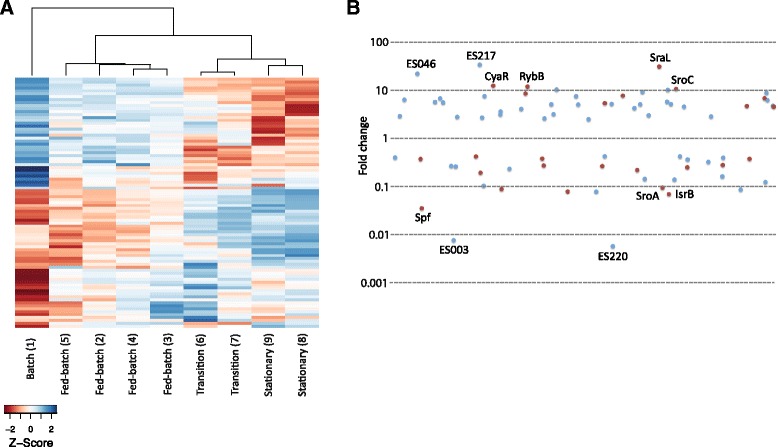
Fig. 4.

Differential expression of small RNAs during high cell density fermentation. a Heat map showing relative expression levels of small RNAs during high cell density fermentation and the dendrogram provides visualization of a hierarchical clustering of experimental conditions. The columns correspond to sRNA expression patterns of samples harvested at different time points during the fermentation indicated in Fig. 1b and ordered consecutively according to time of harvest, batch (point 1), fed-batch (points 2–5), transition (points 6–7) and stationary (points 8–9) phases. Only the eighty-four sRNAs exhibiting significant differential expression are included. A scale of z-score relation to color intensity is shown. b The magnitude of expression changes for each differentially expressed sRNA between stationary and batch exponential growth phases is shown. Novel and previously detected sRNAs are represented by blue and red symbols, respectively. The names of some of the sRNAs with the largest fold expression changes are indicated
