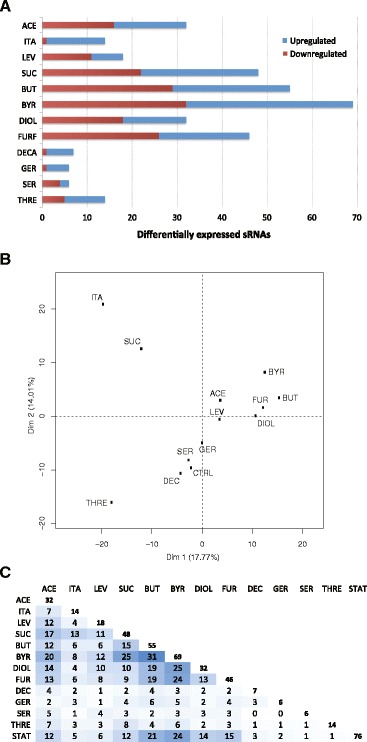
Fig. 5.

Differential sRNA expression under chemical stress conditions. a Bar graph indicating the number of sRNAs whose expression is significantly changed for each chemical stress condition. b Principal component analysis. The data shown represent average expression values of three biological replicates for all stress conditions except in the presence of decanoic acid, itaconic acid and threonine, where there is only one replicate. The samples represent chemical stress conditions with the indicated compound, whereas the control (CTRL) is without an added chemical. c The number of differentially expressed sRNAs in each stress condition is shown on the diagonal. The other positions show the number of common sRNAs exhibiting differential expression in the same direction under each combination of two stress conditions. Increasing numbers of commonly differentially expressed transcripts are highlighted from light to dark blue
