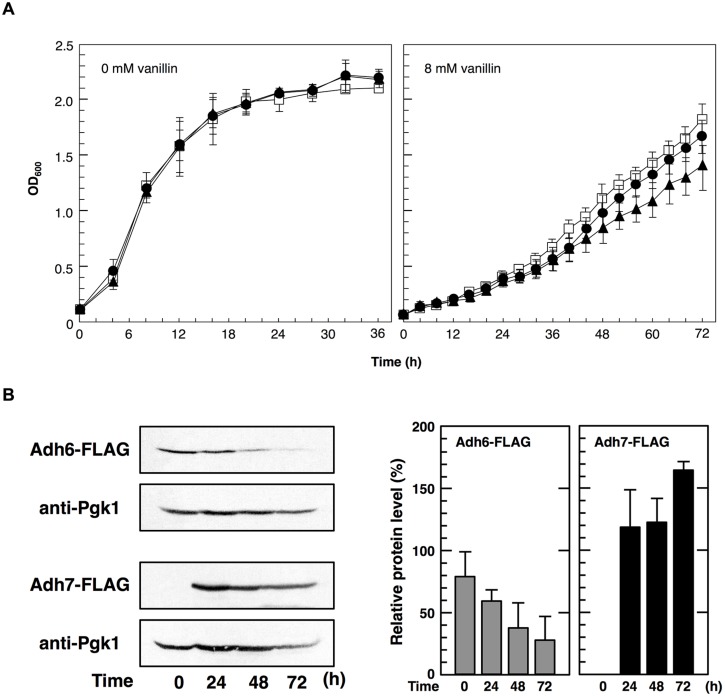
FIGURE 4.
Cells were cultured at 28°C in SD medium containing 8 mM vanillin. (A) Growth of adh6Δ and adh7Δ cells was monitored by measuring the optical density at 600 nm (OD600). Data are shown as the mean ± SD of three independent experiments. The strains examined were as follows: open squares, wild type; closed circles, adh6Δ; closed triangles, adh7Δ. (B) Changes in Adh6 and Adh7 levels during cultivation were monitored by western blot analysis using an anti-FLAG antibody. Pgk1 was used as a loading control. Protein levels of Adh6 and Adh7 were normalized to that of Pgk1 using ImageJ, and the intensity of Pgk1 band of each lane was considered 100%. Data are shown as the mean ± SD of three independent experiments.

