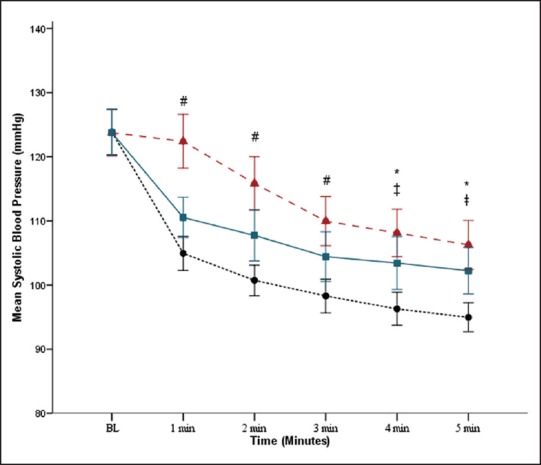
Figure 1.

Comparison of mean systolic blood pressure with respect to time among propofol-saline (PS), (•), propofol-phenylephrine (PP), (Δ) and propofolephedrine (PE), (◾). *P < 0.05 PS versus PP; ‡P < 0.05 PS versus PE; #P < 0.05 all multiple groups comparison significant
