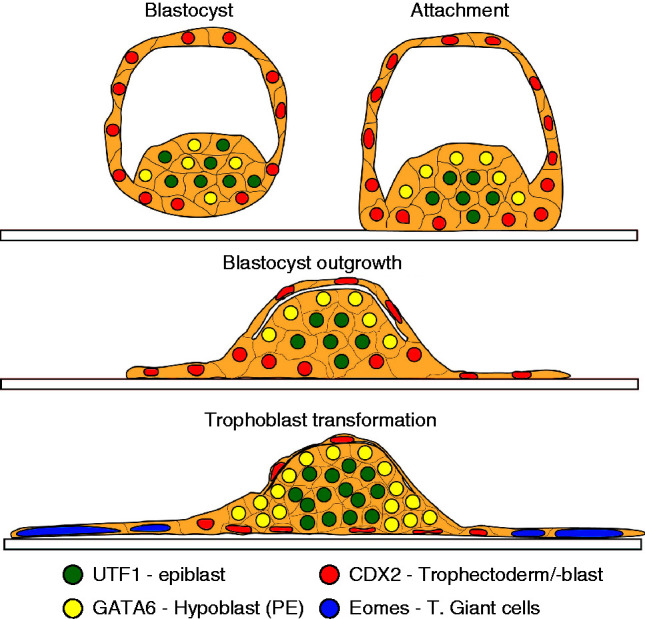
Figure 7.

A diagrammatic representation of the changes in blastocyst morphology during blastocyst outgrowth over 48 h cultures of blastocysts in vitro. The formation and allocation of cells to each of the cell populations defined by the lineage markers are shown. These structures correspond to the confocal images shown in Fig. 4.

 This work is licensed under a