Figure 8.
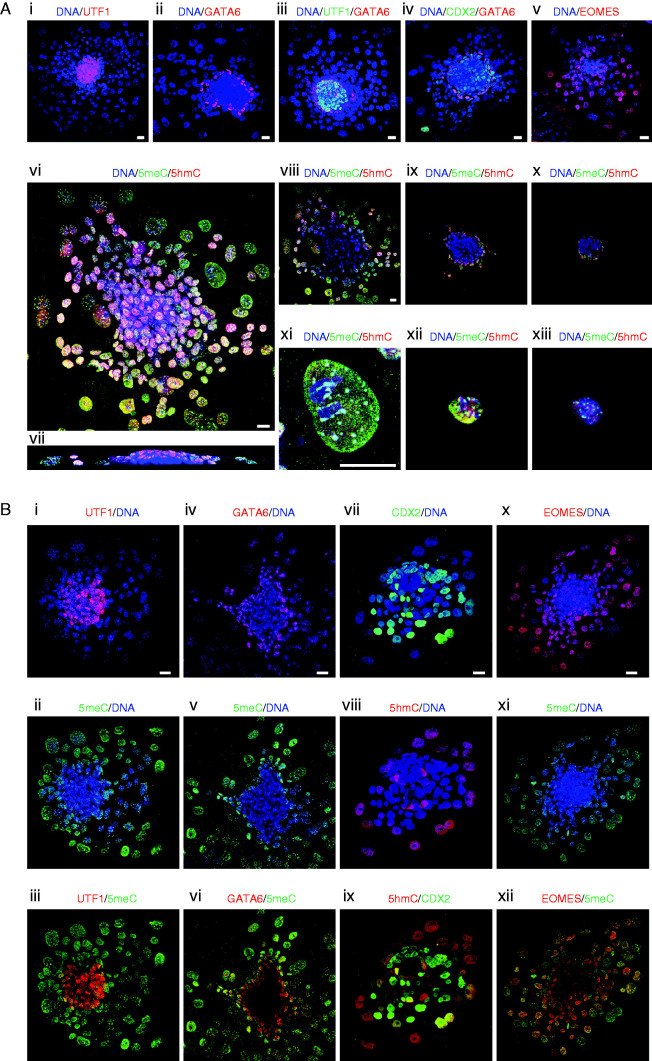
Changes in 5meC and 5hmC staining in each lineage formed during implantation in vitro. (A) Panels i, ii, iii, iv and v are z-stack projections of 48 h blastocyst outgrowths and show the localization and distribution of each lineage formed during outgrowth. All cells were stained for DNA (DAPI, blue) and for the lineage markers: i) epiblast (UTF1, red); ii) hypoblast (GATA6, red); iii) epiblast (UTF1, green), and hypoblast (GATA6, red); iv) trophoblast (CDX2-green) and hypoblast (GATA6, red); and v) TGCs (EOMES, red). vi, vii, viii, ix, x, xi, xii, xiii, xiv) staining of outgrowths for 5meC (green), 5hmC (red), and DNA (DAPI, blue) of a vi) z-stack projection in the x–y dimension and vii) cross-section in x–z dimension; viii, ix, x) single confocal sections at progressive heights along the z-axis through the embryo shown in vi. xi, xi, xii, xiii) Higher power images of individual xi) TGC, xii) small TB, and xiii) hypoblast cells respectively. (B) Blastocyst outgrowths co-stained for 5meC or 5hmC and markers for each lineage. Each panel shows a z-stack projection in the x–y dimension of representative 48 h blastocyst outgrowths. Merged images of staining for lineage markers and cytosine modifications: epiblast i) UTF1 (red) with DNA (blue), ii) the same embryo stained for 5meC (green) and DNA, iii)UTF1 (red) with 5meC (green); hypoblast iv) GATA6 (red) with DNA (blue), v) 5meC (green) with DNA, vi) GATA6 (red) with 5meC (green); trophoblast vii) CDX2 (green) with DNA (blue), viii) 5hmC (red) with DNA (blue); TB ix) CDX2 (green) with 5hmC (red); TGCs x) EOMES (red) with DNA, xi) 5meC (green) with DNA (blue), xii) EOMES (red) with 5meC (green). All scale bars=20 μm.

 This work is licensed under a