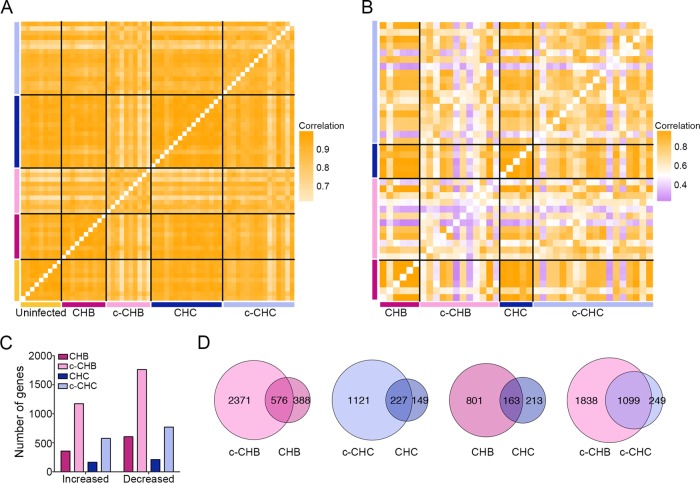
FIG 1 .
Global gene expression in chronic viral hepatitis and cancer. (A and B) Pearson correlation coefficient heat maps. Each cell in the map represents the correlation in expression profiles between two samples. Cells along the diagonal line represent identical samples and are shown in white. Black lines divide each disease group. The midpoint for color bar r2 is 0.5. (A) Data from microarray analyses include only genes with average normalized expression of >1,000 (n = 8,162) in uninfected controls (n = 9), CHB and matched c-CHB (n = 10 each), and CHC and matched c-CHC (n = 16 each). (B) The Cancer Genome Atlas RNA-seq data include genes with an average normalized read count of >50 (n = 13,017) in each disease category: c-CHB (n = 12), CHB (n = 6), c-CHC (n = 18), and CHC (n = 5). (C and D) Analysis of differentially expressed (DE) genes in each disease category compared to the uninfected controls with a fold change of >2 and ANOVA P value of <0.05 after Benjamini-Hochberg step-up multiple testing correction. (C) Number of DE genes. (D) Proportional Venn diagrams comparing the DE genes of the different disease groups.

