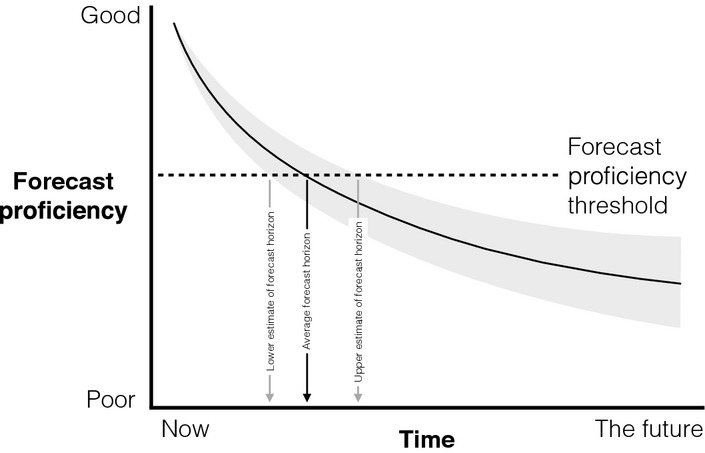
Figure 1.

The forecast horizon is the time at which average forecast proficiency (black curved line) falls below the forecast proficiency threshold. Because forecast proficiency at any particular time will be a distribution (e.g. grey area) there will be a distribution of forecast horizons that can be used as an estimate of uncertainty in forecast horizon (e.g. give a lower and upper estimate of the forecast horizon).
