Figure 6.
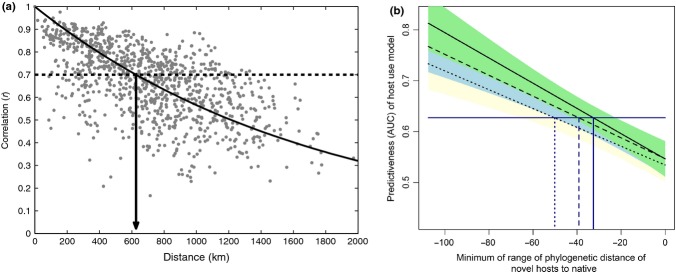
Spatial and phylogenetic forecast horizons. (a) Distance-decay of similarity in community composition. With a forecast proficiency threshold of 0.7 correlation, there is a forecast horizon of just over 600 km. This example uses Pearson correlation of square-root transformed abundances as a measure of similarity of relative abundance between pairs of routes from the North American Breeding Bird Survey. (b) Fitted relationships between forecast proficiency (AUC) and phylogenetic distance (MYA) when all data were used to parameterise the forecasting model (solid line, green shading), when 2/3 of the data were used (dashed line, blue shading) and when 1/3 of the data were used (dotted line, yellow shading). The horizontal line is the median AUC for predictions from the full model. The prediction threshold for models built using reduced data sets occurred at a coarser phylogenetic distance, indicating that increased information allows finer predictions of host use over plant phylogeny. Fits are linear regressions and shaded areas the standard error of the regression.

