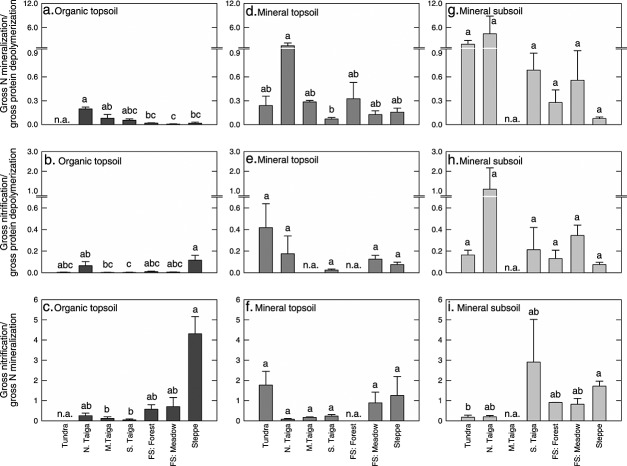
Figure 5.
Ratios between gross rates of protein depolymerization, N mineralization, and nitrification in three soil horizons of seven ecosystems along a latitudinal transect in western Siberia. All bars represent means with standard errors. The different letters indicate significant differences between sites for each horizon. N. Taiga: northern taiga; M. Taiga: middle taiga; S. Taiga: southern taiga; and FS: forest steppe.

