
Fig 1.
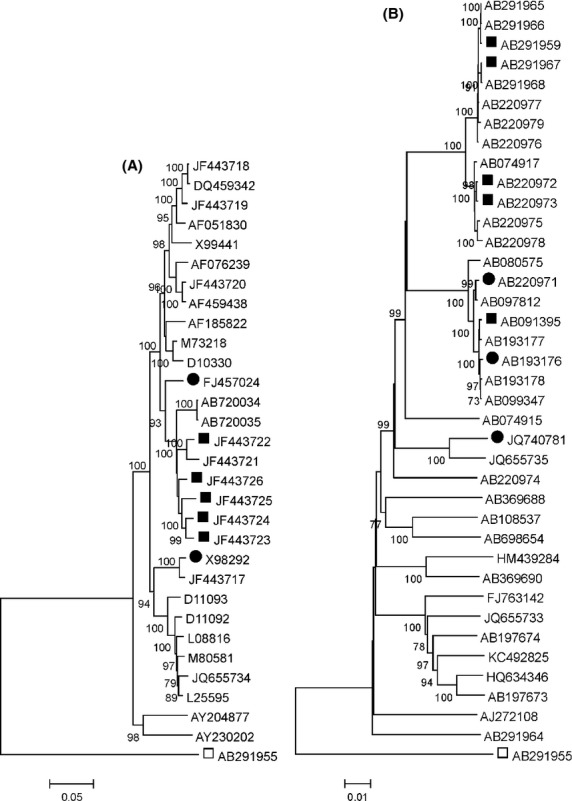
Phylogenetic analysis of complete HEV sequences from FH and non-FH patients. Distances between HEV genotype 1 (A) and genotype 4 (B) complete genome sequences are presented on a neighbor-joining tree (FH patients are indicated by symbols, ▪ for FH isolates from Pune or Hokkaido, and • for other FH isolates, □ for the genotype 3 outgroup). Branches supported by >70% of bootstrap replications (n = 500) are indicated.