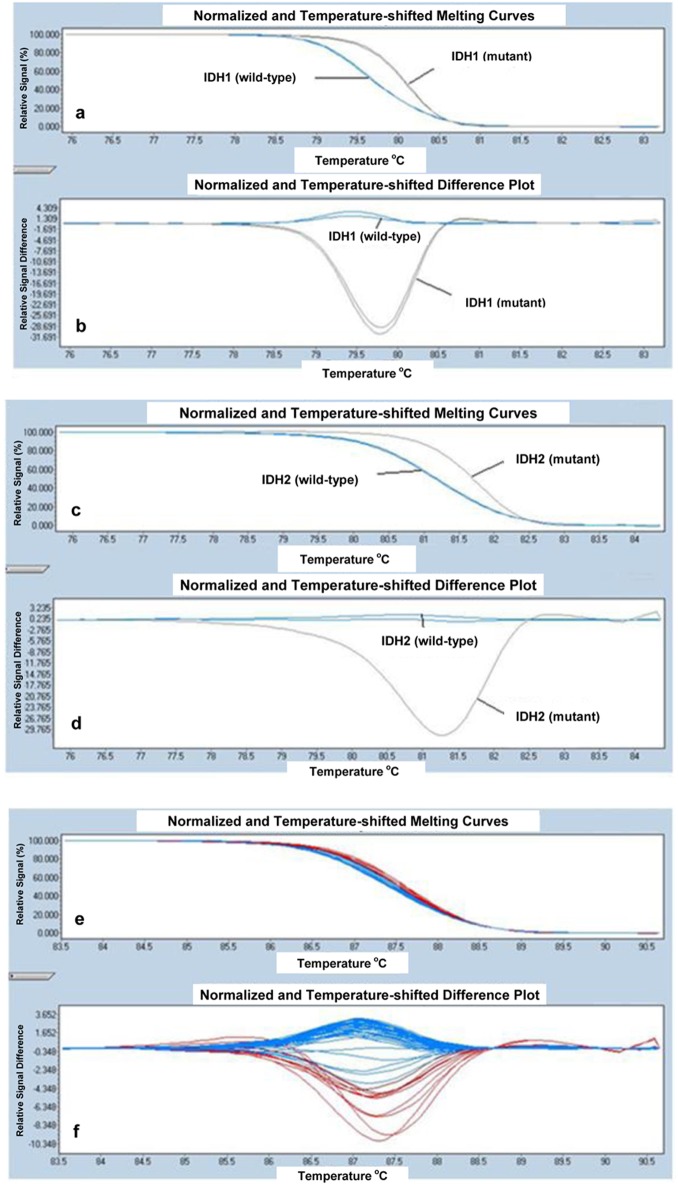
Figure 1.
HRM curve analysis for IDH1 (R132) samples. The differential melting properties of wild-type and mutant type IDH1 (R132) using (a) normalized and temperature-shifted melting curves and (b) normalized and temperature-shifted difference plots. HRM curve analysis for IDH2 (R140) samples. The differential melting properties of wild-type and mutant type IDH2 (R140) using (c) normalized and temperature-shifted melting curves and (d) normalized and temperature-shifted difference plots. HRM curve analysis for IDH2 (R172) samples. The melting properties of IDH2 (R172) are shown using (e) normalized and temperature-shifted melting curves and (f) normalized and temperature-shifted difference plots. All samples of IDH2 (R172) showed the same pattern of melting temperature indicating that all patient samples are wild-type for IDH2 (R172).

