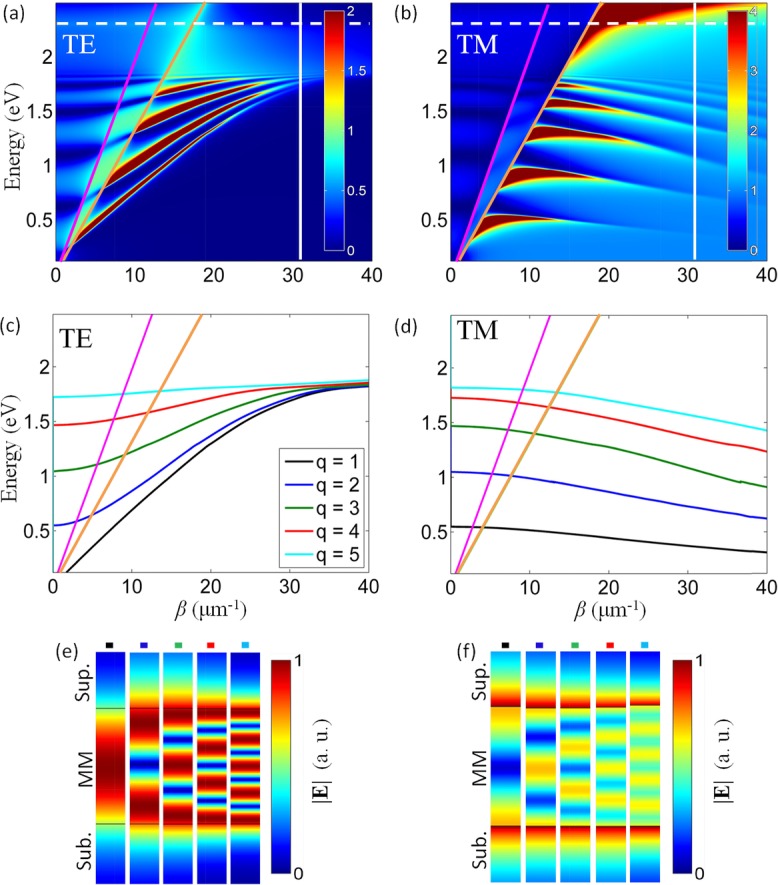
Figure 4.

Reflection dispersion of the metamaterial slab calculated using the complex-angle TMM method (a) and (b) and analytic model (c) and (d) for a waveguide of 400 nm thickness with p = 0.5: (a) and (c) TE and (b) and (d) TM modes. The analytic model shows the 5 lowest (1 ≤ q ≤ 5) modes. The dashed line indicates the effective plasma frequency. The vertical line corresponds to the boundary of the Brillouin zone of the metamaterial realization when considering a square lattice of nanorods. The modes in (a) and (b) correspond to the minima of reflectance. Light lines in the superstrate (magenta) and the substrate (orange) are also shown. (e) and (f) The spatial distributions of the norm of the electric field for the q = 1–5 modes as obtained from the eigenmode simulations for (e) TE and (f) TM modes.
