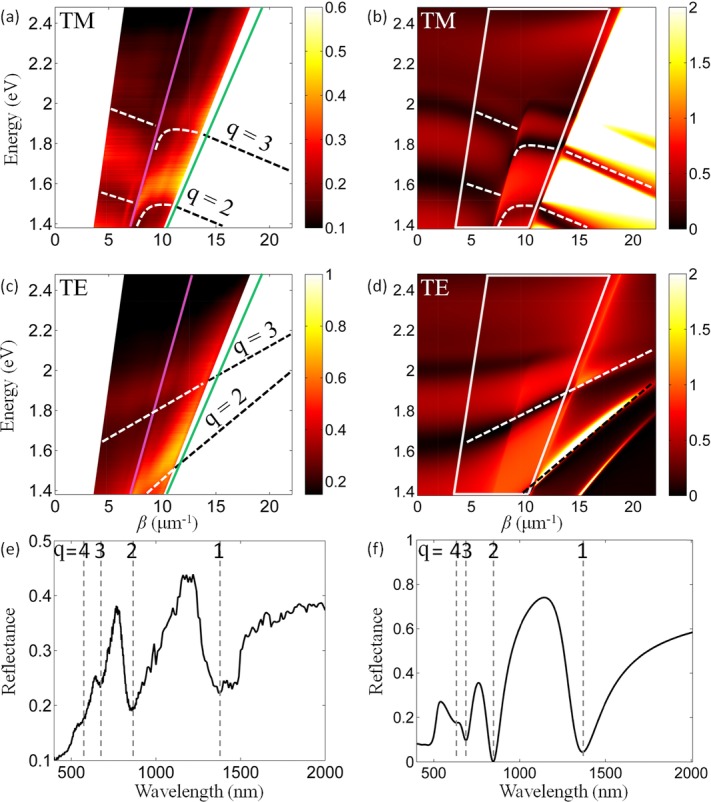
Figure 6.

Experimentally measured (a) and (c) and simulated (b) and (d) reflectance dispersions for a 340-nm thick metamaterial slab with p ≈ 0.32 (the nanorod period is ∼100 nm and radius is ∼32 nm): (a) and (b) TM, (c) and (d) TE modes. The light lines in the substrate (silica, green) and the superstrate (air, magenta) are shown. The Au nanorods are embedded in an AAO matrix. The modes with q = 2 and 3 are tracked with dashed lines as a guide to the eye. The angular range measured in the experiment (20–75° in the substrate) is indicated with white boxes in (b) and (d). (e) and (f) Experimental and simulated reflectance spectra at the angle of 60o for TM polarization as extracted from (a) and (b). The first four modes (q = 1–4) are indicated with dashed lines.
