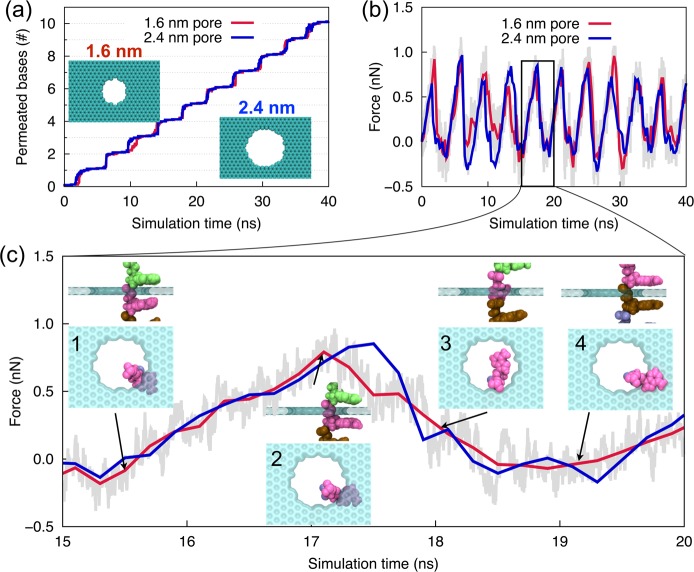
Figure 3.
Translocation of poly(dA) ssDNA through graphene nanopores. Number of permeated nucleotides (a) and the associated pulling force (b) during 40 ns simulation, as well as the pulling force during a single base permeation step (15–20 ns) (c) when ssDNA is pulled through 1.6 nm (red line) and 2.4 nm (blue line) diameter graphene nanopores at a constant velocity of 2 Å/ns. Insets in (c) show side and top views of the ssDNA–graphene nanopore complex at different stages of a single base permeation step.

