Abstract
The aim of the present study was to find out whether early cardiac changes in patients receiving chemotherapy can be detected by the conventional and deformation parameters of 2D and 3D echocardiography. Twenty-five healthy subjects with normal regional left ventricular function (group 1) and 25 patients receiving chemotherapy (group 2) underwent 2D and 3D transthoracic echocardiography (Toshiba Artida Medical System). All patients (group 2) were examined before and during cardiotoxic chemotherapy at a 3-month follow-up. Left ventricular volumes, ejection fraction, muscle mass, global longitudinal, global radial, global circumferential strain, and rotation were analyzed with 2D and 3D echocardiography, while twist and time-to-peak-intervals were analyzed with 3D echocardiography. For left ventricular volumes and muscle mass, no significant differences were seen between the two study groups (P<0.05). According to our results, myocardial dysfunction induced by cardiotoxic chemotherapy can be detected by 2D global radial strain. Detecting myocardial dysfunction by global longitudinal and circumferential strain requires more than 3 months follow-up. Changes in rotation, twist or time-to-peak intervals could not be verified at the 3-month follow-up in the present study. 2D global radial strain seems to be the most sensitive and robust parameter to detect early myocardial damage during chemotherapy. 3D echocardiography is not yet an established method to detect myocardial damage in clinical practice due to lower spatial and temporal resolution.
Keywords: 2D speckle tracking echocardiography, 3D speckle tracking echocardiography, cancer, chemotherapy, cardiotoxicity
Introduction
Cardiotoxicity is the most important side effect of anthracycline and other chemicals affecting the myocardium. It is well known that anthracyclines and trastuzumab induce left ventricular dysfunction. Two types of cardiotoxicity are distinguished (1, 2). The early-onset anthracycline-induced cardiotoxicity occurs within the 1st year after chemotherapy. This type of cardiotoxicity is difficult to treat and in most cases leads to the worsening of cardiac function. Thus, there is a considerable risk for developing late-onset anthracycline-induced heart failure. Unfortunately, heart failure therapy can hardly influence the natural course of this type of myocardial damage. The other type of cardiotoxicity causes a reversible deterioration of myocardial function after cancer therapy. It is mostly observed in patients treated with cyclophosphamide, and is mainly due to edema and pericardial affections, and may be the consequence of excessive enzyme release or other stress-induced factors (3, 4).
For conventional analysis, left ventricular volumes and left ventricular ejection fraction (LVEF) are the most widely used parameters to detect cardiotoxicity, whereas changes in ejection fraction seem to underestimate cardiac damage (5, 6). Deformation analysis, especially modern parameters such as rotation and twist, seems to be a promising tool to detect myocardial affection at an earlier stage; therefore, cancer therapy can be adjusted, and irreversible early-onset anthracycline-induced myocardial damage can be avoided.
The aim of the present study was to find out whether early cardiac changes in patients receiving chemotherapy can be detected by the conventional and deformation parameters of 2D and 3D echocardiography. It was hypothesised that global radial-, circumferential- and longitudinal strain, rotation and twist are more sensitive than LVEF at detecting early cardiac changes within 3 months of chemotherapy course.
Methods
Study sample
From November 2012 to April 2013 two groups of 25 and 25 subjects respectively (n=50) were enrolled in the study. All subjects provided informed consent after full explanation of the purpose and nature of the study. All procedures were approved by the local ethical committee. Subjects with LVEF <30% before chemotherapy, cardiac arrhythmias, mild or severe valvular stenoses or regurgitations, prosthetic valves, pacemaker and insufficient image quality were excluded. Only subjects with excellent image quality were included in the study. Excellent image quality enables reliable tracking of the myocardial speckles and, therefore, good tracking curves. In group 1 twenty-five healthy subjects (controls) free from major cardiovascular diseases or cardiovascular risk factors were analyzed. In group 2 twenty-five patients with various types of malignancy undergoing several types of cardiotoxic chemotherapy were investigated before and during chemotherapy at a mean follow-up of 3 months (±2 weeks). Clinical data of all controls (group 1) and all patients (group 2) are shown in Table 1. The various tumor types included in the study are acute myeloid leukaemia (1), B-cell non-Hodgkin lymphoma (1), multiple myeloma (2), breast (10), stomach (4), lung (2), hepatocellular (1), thyroid (1) and lingual cancer (2) and renal cell carcinoma (1).
Table 1.
Clinical data of both cohorts.
| Clinical data | Group 1 (n=25) | Group 2 (n=25) | P |
|---|---|---|---|
| Age | 45±12 | 63±15 | 0.37 |
| Male | 16 (64%) | 11 (44%) | 0.13 |
| Female | 9 (36%) | 14 (56%) | 0.13 |
| Smoker | 6 (24%) | 7 (28%) | 0.71 |
| Alcohol consumption | 0 (0%) | 0 (0%) | NS |
| Arterial hypertension | 5 (20%) | 11 (44%) | 0.41 |
| Coronary heart disease | 0 (0%) | 2 (8%) | 0.15 |
| Pulmonary embolism | 0 (0%) | 1 (4%) | 0.31 |
| Diabetes mellitus type 2 | 0 (0%) | 5 (20%) | 0.16 |
| Peripheral arterial disease | 0 (0%) | 2 (8%) | 0.15 |
| Hypercholesterinemia | 0 (0%) | 2 (8%) | 0.15 |
| Chronic obstructive pulmonary disease | 0 (0%) | 4 (16%) | 0.34 |
| β-blocker therapy | 10 (0%) | 7 (28%) | 0.29 |
| Ace-inhibitor therapy | 11 (0%) | 5 (20%) | 0.29 |
| Calcium antagonist therapy | 0 (0%) | 2 (8%) | 0.15 |
Chemotherapy was performed with anthracycline (n=7), platinium-based antineoplastic agents (n=4), taxoids (n=5), paclitaxel (n=1), MABs (n=6), kinase inhibitors (n=2), alkylating agents (n=3) and their combination (taxoid-anthracycline, MAB-anthracycline, or MAB-platinum based antineoplastic agent).
Ehocardiographic methods
All controls and patients underwent 2D and 3D transthoracic echocardiography according to the European and American guidelines using Toshiba Artida Medical System (Zoetermeer, The Netherlands) with PST-25SX 1 MHz to 4 MHz phased-array matrix probe for 3D image acquisition (7, 8). LVEF, left ventricular end-diastolic volume (LVEDV), left ventricular end-systolic volume (LVESV), left ventricular muscle mass and global longitudinal (GLS), global radial (GRS) and global circumferential strain (GCS) were measured offline using the 16-segment model of 2D and 3D echocardiography.
2D parasternal short axis views were acquired at the level of the left ventricular apex, the papillary muscles and the mitral valve for determination of global radial and circumferential strain by 2D speckle tracking (ST). 2D apical long axis, two- and four-chamber views were acquired for determination of global longitudinal strain by 2D ST. 2D apical views were acquired at fixed sectional planes with differences of ∼60° between each other. All 2D views were compared to views of the triplane approach. In addition, rotation and twist were analyzed by 3D ST. Rotation refers to myocardial rotational displacement around the long axis of the left ventricle. The difference between the apex-to-base left ventricular rotation is referred to as the net LV twist angle (9). Peak strain was measured during the ejection time in patients with normal deformation patterns, and after aortic valve closure in patients with post-systolic peak strain. The time-to-peak interval describes the time interval between aortic valve opening and the maximum strain during systole. Longitudinal, radial and circumferential time-to-peak intervals were measured in all 3D data sets of all controls and patients. LVEF was measured with semiautomatic 3D wall motion tracking (wall motion tracking Software, Toshiba Medical Systems). According to the methodological prerequisite for 2D ST, the frame rate has to be between 40 and 80 frames/s. In the present data sets, the frame rate was between 30 and 60 fps, with a mean value of 57±6 and 25±2 in 2D and 3D ST respectively. The width of the tracking area was manually selected. In all controls and patients, full myocardial tracking was performed. In patients with mild to moderate left ventricular hypertrophy, tracking areas were adjusted to the wall thickness to ensure full myocardial tracking. The end-systole was determined automatically by the software at the time of aortic valve closure.
Statistical analysis
Mean values and s.d. were calculated. Comparisons between groups 1 and 2 were performed by independent sample t-test. In group 2, data obtained before and after chemotherapy were compared with the help of paired sample t-test. P values <0.05 were considered statistically significant. Statistical analysis was carried out with SPSS Software v. 17.0 (SPSS, Inc.).
Results
In the present study, 16 segments of 25 controls and 25 patients were tracked and analyzed with 2D and 3D ST and 3D wall motion tracking. Conventional parameters are shown in Table 2. Compared to group 1, LVEF was reduced in group 2 at both time points (before and after chemotherapy). However, LVEF was not different in group 2 at the 3-month follow-up. For left ventricular volumes and left ventricular muscle mass, no significant differences were observed in the two study groups (Table 2). In comparison to group 1, 2D GCS and 2D GLS were significantly higher at the 3-month follow-up, although there was no significant difference between group 1 and baseline group 2 data (before chemotherapy). However, for 2D radial strain significant differences were observed between group 1 and baseline group 2 data (before chemotherapy), and between baseline and 3-month follow-up group 2 data (Table 3). 2D views and the corresponding strain curves are shown in Figs 1, 2, 3, 4, and 5. Values of 3D global circumferential strain were significantly higher in group 2 (both before and during chemotherapy) in comparison to group 1 (Table 3). In contrast, no differences were observed in group 2 before and during chemotherapy. 3D radial, circumferential and longitudinal strain curves are shown in Fig. 6. A subgroup analysis was additionally performed with 3D ST in patients treated with anthracycline (n=7). There was no difference between baseline and 3-month follow-up values (global radial strain 31.12±9.23 vs 29.85±18.46, global circumferential strain 23.31±4.21 vs −22.87±4.10, global longitudinal strain −12.56±2.45 vs −12.72±2.91). For 3D rotation, 3D twist and 3D time-to-peak intervals, no significant differences were seen (Table 3).
Table 2.
Comparison of conventional parameters between groups 1 and 2 and between different time points (group 2 before and during chemotherapy); *P value <0.05.
| Group 1 | Group 2 (before chemotherapy) | Group 2 (during chemotherapy) | |
|---|---|---|---|
| 3D LVEF (%) | 57±9 | 50±16*, a | 49±7*, b |
| 3D LVEDV (ml) | 108±36 | 113±22 | 108±28 |
| 3D LVESV (ml) | 47±25 | 56±14 | 55±16 |
| 3D muscle mass (g) | 133±24 | 150±29 | 149±27 |
LVEF, left ventricular ejection fraction; LVEDV, left ventricular end-diastolic volume; LVESV, left ventricular end-systolic volume.
Comparison between groups 1 and 2 (before chemotherapy).
Comparison between groups 1 and 2 (during chemotherapy).
Table 3.
Comparison of deformation parameters between groups 1 and 2 and between different time points (group 2 before and during chemotherapy); *P value <0.05.
| Group 1 | Group 2 (before chemotherapy) | Group 2 (during chemotherapy) | |
|---|---|---|---|
| 3D global radial strain (%) | 34±16.67 | 28±12.75 | 26±14.48 |
| 3D global circumferential strain (%) | −28±1.71 | −21±4.50*, a | −22±4.70*, b |
| 3D global longitudinal strain (%) | −14±1.52 | −13±2.55 | −12±2.23 |
| 2D global radial strain (%) | 23±9.38 | 28±10.56*, a | 21±11.53*, c |
| 2D global circumferential strain (%) | −23±3.77 | −21±7.82 | −18±8.21*, b |
| 2D global longitudinal strain (%) | −16±2.90 | −15±4.20 | −14±4.56*, b |
| 2D rotation (°) | 1.3±0.27 | 1,02±0.24 | 0,82±0,18 |
| 3D rotation (°) | 3.5±0.28 | 3.4±2.17 | 3.3±2.34 |
| 3D twist (°/cm) | 3.5±2.24 | 4.2±2.68 | 4.4±2.88 |
| 3D time-to-peak interval (radial) (ms) | 402±79.09 | 402±65.90 | 389±80.32 |
| 3D time-to-peak interval (circumferential) (ms) | 359±70.17 | 382±45.03 | 380±76.74 |
| 3D time-to-peak interval (longitudinal) (ms) | 375±68.28 | 379±55.09 | 355±65.71 |
Comparison between groups 1 and 2 (before chemotherapy).
Comparison between groups 1 and 2 (during chemotherapy).
Comparison between group 2 before and group 2 during chemotherapy.
Figure 1.
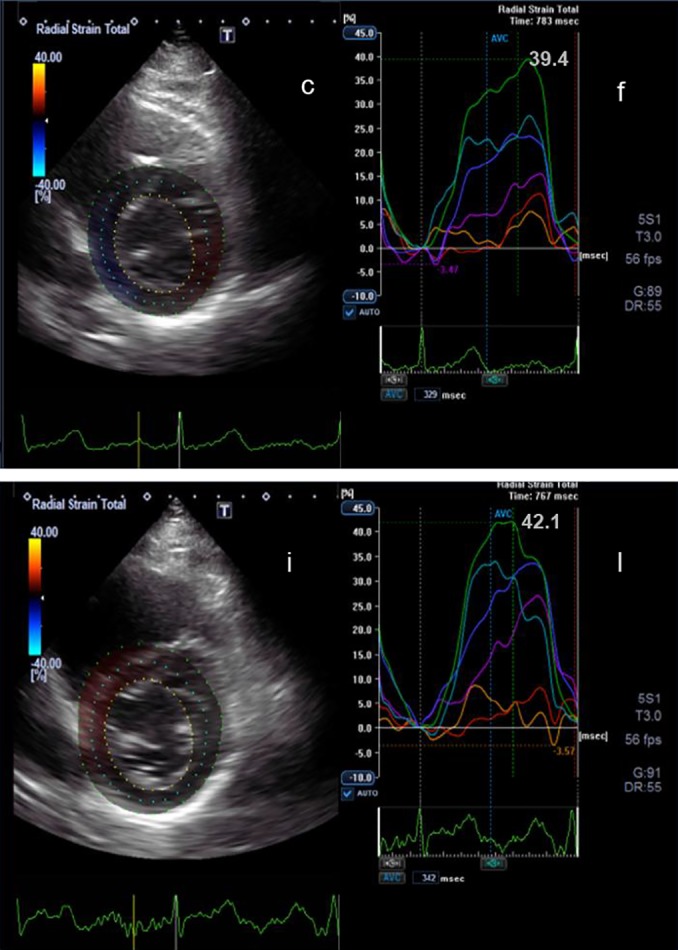
2D parasternal short axis view at the level of the mitral valve (c) and the corresponding radial strain curves (f) before chemotherapy are shown. Below the corresponding view (i) and radial strain curves (l) during chemotherapy after 3 months are shown. The peak radial strain at the beginning of the chemotherapy is 39.4% and after 3 month is 42.1%.
Figure 2.
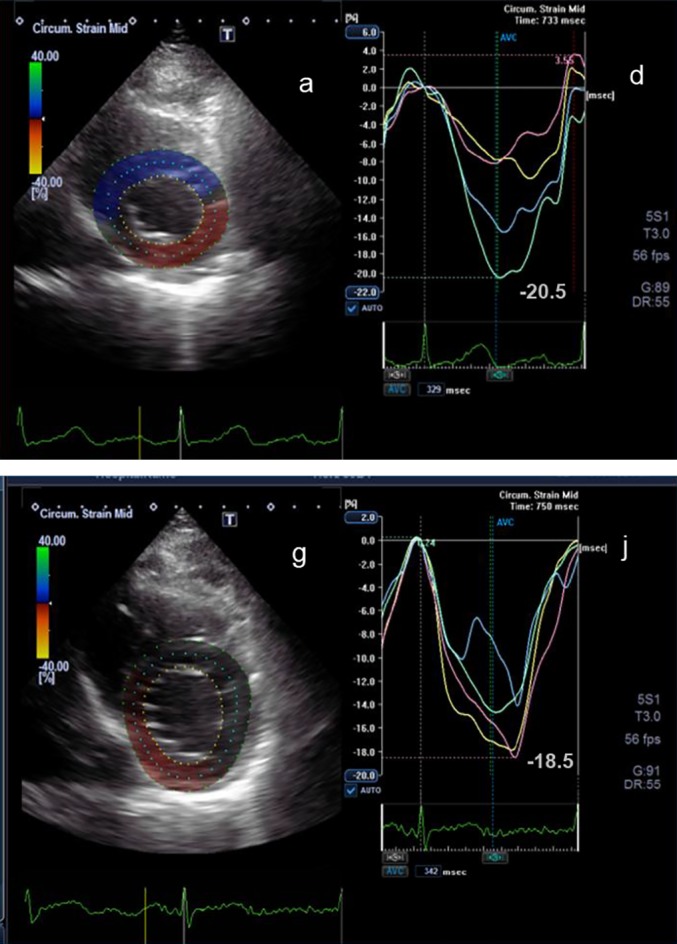
2D parasternal short axis view at the level of the left ventricular apex (a) and the corresponding circumferential strain curves (d) before chemotherapy are shown. Below the corresponding view (g) and circumferential strain curves (j) during chemotherapy after 3 months are shown. The peak circumferential strain at the beginning of the chemotherapy is −20.5%) and after 3 months is −18.5%.
Figure 3.
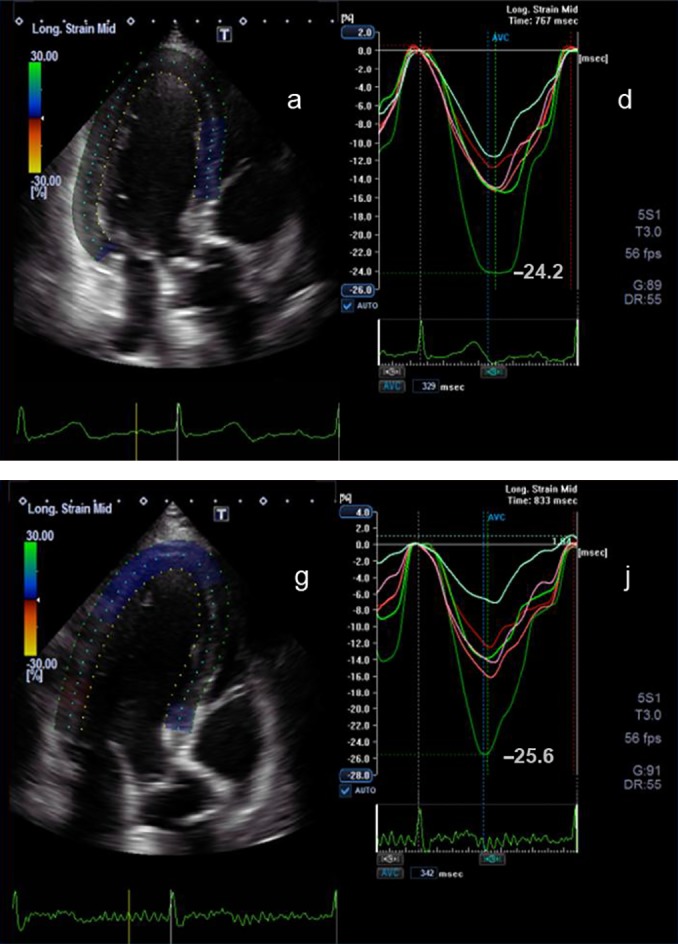
2D apical long axis view (a) and the corresponding longitudinal strain curves (d) before chemotherapy are shown. Below the corresponding view (g) and longitudinal strain curves (j) during chemotherapy after 3 months are shown. The peak longitudinal strain at the beginning of the chemotherapy is −24.2% and after 3 months is −25.6%.
Figure 4.
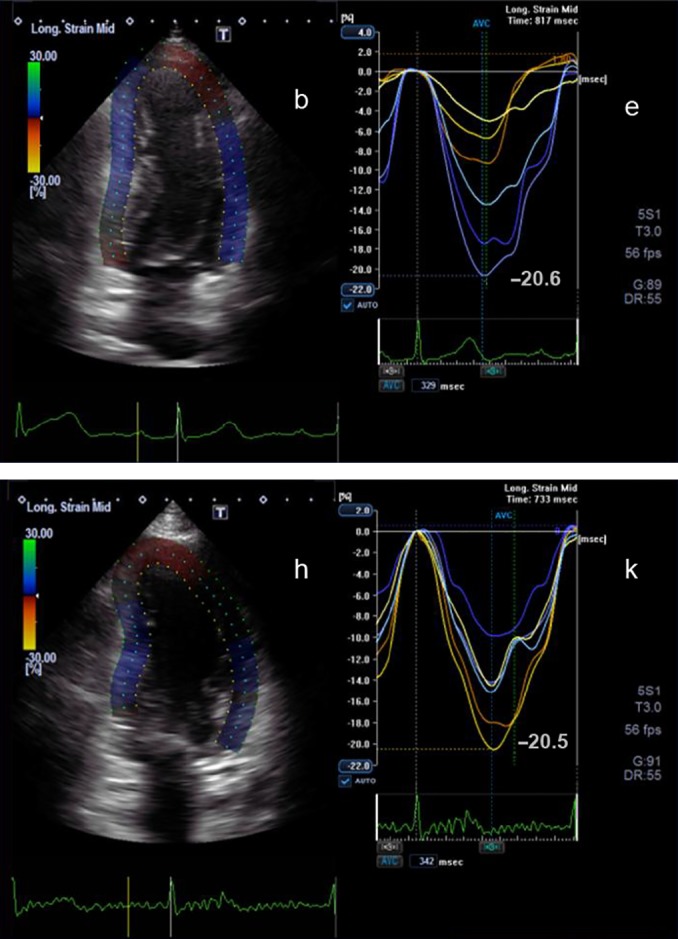
2D apical two-chamber view (b) and the corresponding longitudinal strain curves (e) before chemotherapy are shown. Below the corresponding view (h) and longitudinal strain curves (k) during chemotherapy after 3 months are shown. The peak longitudinal strain at the beginning of the chemotherapy is −20.6% and after 3 months is −20.5%.
Figure 5.
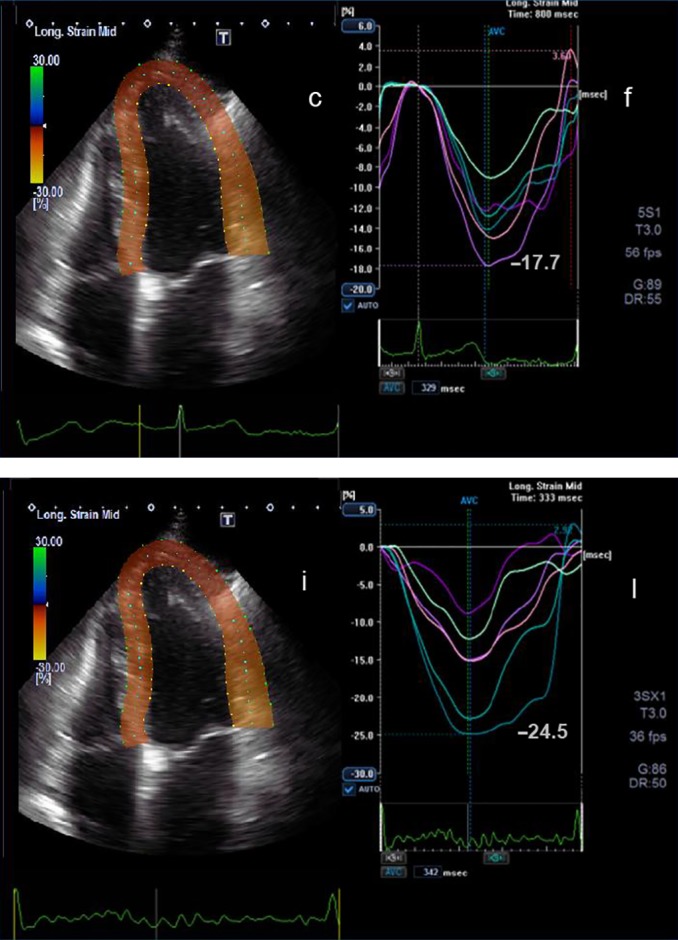
2D apical four-chamber view (c) and the corresponding longitudinal strain curves (f) before chemotherapy are shown. Below the corresponding view (i) and longitudinal strain curves (l) during chemotherapy after 3 months are shown. The peak longitudinal strain at the beginning of the chemotherapy is −17.7% and after 3 months is −24.5%.
Figure 6.
3D radial strain curves of a patient before (a) and during (b) chemotherapy after 3 months are shown. 3D circumferential strain curves of a patient before (c) and during (d) chemotherapy after 3 months are shown. 3D longitudinal strain curves of a patient before (e) and during (f) chemotherapy after 3 months are shown.
Reproducibility
In ten randomly selected patients, 2D and 3D measurements were performed by another investigator twice within 5 weeks to determine intra-observer variability. In addition, in ten randomly selected patients, 2D and 3D measurements were carried out by two independent investigators to determine inter-observer variability. Intra-observer and inter-observer variability of strain measurements were 4.1±1.9% and 6.1±1.8%, respectively.
Discussion
In clinical practice LVEF is the most commonly used parameter to detect damages in the heart evoked by chemotherapy. Recently, new parameters have been established in deformation imaging for the evaluation of LV function in clinical practice. With the help of this method, follow-up investigations can be carried out during chemotherapy. It is known that strain and LVEF are different entities. Global strain reflects the fractional change of LV dimensions, comparing the maximum end-diastolic dimension with the maximum contracting state at systole. In contrast, LVEF reflects the volumetric fraction, which depends on the size and shape of the left ventricle, the contraction of the global myocardium, the integrity of the mitral and aortic valve, and diastolic filling. In a cohort of patients with preserved myocardial function and no or only mild valvular affections as well as with a good acoustic window, global strain was shown to be more robust than LVEF to characterize global LV systolic function (10). Sawaya et al. (11) have shown that the predictive value of LVEF to detect sequelae of cardiotoxicity in early phase is very low in comparison to strain and myocardial markers. In their study, a heterogeneous group of patients treated with chemo- and radiotherapy was investigated, and it was found that reduced longitudinal and radial strain obtained after 3 months of cancer treatment may predict later development of cardiotoxicity. Stoodley et al. (12) have observed reduced longitudinal and radial strain 1 week after anthracycline therapy. In the present study the mean strain values of 3D radial and 3D circumferential strain were reduced in the patient cohort at baseline suggesting that patients with already reduced myocardial function were enrolled. Yet, due to the limited spatial and temporal resolution of 3D speckle tracking, no significant changes were detected within the first 3 months of cancer treatment. In contrast, 2D radial strain was already reduced 3 months after the beginning of chemotherapy, which suggests that 2D radial strain seems to be an early predictor for myocardial damage even in patients with already reduced LVEF. A higher variability of radial strain measurements was observed, which may be the consequence of the different orientations of cardiac muscle fibers. Most longitudinal muscle fibers are normally located in the subendomyocardial layers, which are mainly represented by longitudinal strain. Whereas circumferential muscle fibers are oriented in the subepimyocardial layers, which are mainly represented by circumferential strain (7, 13, 14). However, there are no muscle fibers in the radial direction. Radial strain is the summation of both longitudinal and circumferential muscle fibers. In addition, the higher variability of radial strain compared to longitudinal strain (Table 3) may be explained by methodological issues such as spatial resolution.
ST analysis is based on specific gray scale patterns that are detected frame by frame during the heart cycle. Speckles arise due to reflexions, and they show a correlation to morphology and tissue but are also influenced by ultrasound wave interactions. Some of these speckles may disappear due to tissue alteration during therapy. In 2D and 3D ST, remarkable differences were seen among controls (group 1) and patients (group 2). There were significant differences of 2D and 3D radial and 3D circumferential strain between controls (group 1) and patients (group 2) before chemotherapy. This is presumably due to the different spatial resolutions of the two kinds of method. As the differences between 2D and 3D speckle tracking are not homogeneous for radial strain, these observations may be explained by methodological issues of resolution and different software algorithms. Moreover, all strain values were quite low, which may be due to different vendor-specific software algorithms and smaller left ventricular cavities of the study subjects.
During the measurements of the circumferential strain and radial strain, speckles move away from the 2D short axis view as a result of the twisting cardiac motion. This ‘out-of-plane motion’ means that speckles were not tracked over the complete cardiac cycle. With the help of 3D echocardiography, these speckles are detected more precisely during the complete cardiac cycle (14). According to our results, circumferential strain values were lower, while radial strain values were higher with 3D ST, compared to 2D ST (Table 3). This is presumably due to the difference of vendor-specific spatial resolution and the corresponding software algorithms. Variability was lower and reproducibility was higher with 3D ST because the apical sectional planes can be better standardized. Inappropriate shortening views can obviously be avoided by simultaneously acquired standardized sectional planes. However, 3D ST has more artefacts and different results compared to 2D ST, even if the same frame rates are used. Consequently, early myocardial changes of strain may not be detected by 3D ST, as 3D ST is performed with a lower spatial resolution and frame rate than 2D speckle tracking.
With the help of speckle tracking, early subclinical changes are detectable. For modern parameters, e.g. rotation and twist, no differences were seen. This may be explained by the fact that these values are measured in the circumferential direction similar to circumferential strain. Mavinkurve-Groothuis et al. (15) have written that after 3 months of anthracycline chemotherapy, an increase in time-to-peak interval is observed. In contrast to their findings, changes in 3D rotation, twist or time-to-peak interval could not be detected after 3 months in the present study.
Conclusion
Myocardial dysfunction induced by cardiotoxic chemotherapy can be detected by conventional and deformation parameters using ST. 2D global radial strain seems to be the most sensitive and robust parameter to detect early myocardial damage during chemotherapy, already after 3 months. For the detection of myocardial damage by 2D global longitudinal and circumferential strain, follow-ups after more than 3 months seem to be necessary. The detection of myocardial damage by 3D ST has not yet been established for clinical practice due to lower spatial and temporal resolution. Thus, our study results suggest that in contrast to 2D ST, 3D ST seems to be limited to detecting subclinical myocardial damage only in patients receiving chemotherapy.
Limitations
The major limitation of the present study is the small number of study subjects. For this reason, further subgroup analyses, e.g. the effect of the various chemotherapy drugs on LV function, may not show relevant results. In addition, the representation of the chemotherapy drugs was inhomogeneous in the present study.
A further limitation is that only controls and patients with excellent image quality were included. Thus, full myocardial tracking of all left ventricular segments could be obtained only in these data sets. However, it can be assumed that myocardial deformation occurred in subjects with bad and excellent image quality.
Declaration of interest
The authors declare that there is no conflict of interest that could be perceived as prejudicing the impartiality of the research reported.
Funding
This research did not receive any specific grant from any funding agency in the public, commercial or not-for-profit sector.
References
- 1. Stoodley PW Richards DA Boyd A Hui R Harnett PR Meikle SR Byth K Stuart K Clarke JL Thomas L Left ventricular systolic function in HER2/neu negative breast cancer patients treated with anthracycline chemotherapy: a comparative analysis of left ventricular ejection fraction and myocardial strain imaging over 12 months European Journal of Cancer 49 2013. 3396–3403. 10.1016/j.ejca.2013.06.046 [DOI] [PubMed] [Google Scholar]
- 2. Seidman A Hudis C Kathryn Pierri M Shak S Paton V Ashby M Murphy M Stewart SJ Keefe D Cardiac dysfunction in the trastuzumab clinical trials experience Journal of Clinical Oncology 20 2002. 1215–1221. 10.1200/JCO.20.5.1215 [DOI] [PubMed] [Google Scholar]
- 3. Yeh ET Bickford CL Cardiovascular complications of cancer therapy: incidence, pathogenesis, diagnosis, and management Journal of the American College of Cardiology 53 2009. 2231–2247. 10.1016/j.jacc.2009.02.050 [DOI] [PubMed] [Google Scholar]
- 4. Gharib MI Burnett AK Chemotherapy-induced cardiotoxicity: current practice and prospects of prophylaxis European Journal of Heart Failure 4 2002. 235–242. 10.1016/S1388-9842(01)00201-X [DOI] [PubMed] [Google Scholar]
- 5. Tan TC Scherrer-Crosbie M Assessing the Cardiac Toxicity of Chemotherapeutic Agents: role of echocardiography Current Cardiovascular Imaging Reports 5 2012. 403–409. 10.1007/s12410-012-9163-3 [DOI] [PMC free article] [PubMed] [Google Scholar]
- 6. Altena R Perik PJ van Veldhuisen DJ de Vries EG Gietema JA Cardiovascular toxicity caused by cancer treatment: strategies for early detection Lancet. Oncology 10 2009. 391–399. 10.1016/S1470-2045(09)70042-7 [DOI] [PubMed] [Google Scholar]
- 7. Evangelista A Flachskampf F Lancellotti P Badano L Aguilar R Monaghan M Zamorano J Nihoyannopoulos P European Association of Echocardiography recommendations for standardization of performance, digital storage and reporting of echocardiographic studies; European Association of Echocardiography European Journal of Echocardiography 9 2008. 438–448. 10.1093/ejechocard/jen174 [DOI] [PubMed] [Google Scholar]
- 8. TTE/TEE Appropriateness Criteria Writing Group Douglas PS Badano LP Khandheria B Stainback RF Weissman NJ TTE/TEE Appropriateness Criteria Technical Panel Brindis RG Patel MR Alpert JS Fitzgerald D et al. ACCF/ASE/ACEP/ASNC/SCAI/SCCT/SCMR 2007 appropriateness criteria for transthoracic and transesophageal echocardiography: a report of the American College of Cardiology Foundation Quality Strategic Directions Committee Appropriateness Criteria Working Group, American Society of Echocardiography, American College of Emergency Physicians, American Society of Nuclear Cardiology, Society for Cardiovascular Angiography and Interventions, Society of Cardiovascular Computed Tomography, and the Society for Cardiovascular Magnetic Resonance endorsed by the American College of Chest Physicians and the Society of Critical Care Medicine Journal of the American Society of Echocardiography 20 2007. 787–805. 10.1016/j.echo.2007.06.011 [DOI] [PubMed] [Google Scholar]
- 9. Mor-Avi V Lang RM Badano LP Belohlavek M Cardim NM Derumeaux G Galderisi M Marwick T Nagueh SF Sengupta PP et al. Current and evolving echocardiographic techniques for the quantitative evaluation of cardiac mechanics: ASE/EAE consensus statement on methodology and indications endorsed by the Japanese Society of Echocardiography Journal of the American Society of Echocardiography 24 2011. 277–313. 10.1016/j.echo.2011.01.015 [DOI] [PubMed] [Google Scholar]
- 10. Feigenbaum H Mastouri R Sawada S A practical approach to using strain echocardiography to evaluate the left ventricle Circulation Journal 76 2012. 1550–1555. 10.1253/circj.CJ-12-0665 [DOI] [PubMed] [Google Scholar]
- 11. Sawaya H Sebag IA Plana JC Januzzi JL Ky B Tan TC Cohen V Banchs J Carver JR Wiegers SE et al. Assessment of echocardiography and biomarkers for the extended prediction of cardiotoxicity in patients treated with anthracyclines, taxanes, and trastuzumab Circulation. Cardiovascular Imaging 5 2012. 596–603. 10.1161/CIRCIMAGING.112.973321 [DOI] [PMC free article] [PubMed] [Google Scholar]
- 12. Stoodley PW Richards DAB Hui R Boyd A Harnett PR Meikle SR Clarke J Thomas L Two-dimensional myocardial strain imaging detects changes in left ventricular systolic function immediately after anthracycline chemotherapy European Journal of Echocardiography 12 2011. 945–952. 10.1093/ejechocard/jer187 [DOI] [PubMed] [Google Scholar]
- 13. Ho SY Anatomy and myoarchitecture of the left ventriculatr wall in morla and in disease European Journal of Echocardiography 10 2009. iii3–iii4. 10.1093/ejechocard/jen243 [DOI] [PubMed] [Google Scholar]
- 14. Mor-Avi V Lang RM Badano LP Belohlavek M Cardim NM Derumeaux G Galderisi M Marwick T Nagueh SF Sengupta PP et al. Current and evolving echocardiographic techniques for the quantitative evaluation of cardiac mechanics: ASE/EAE consensus statement on methodology and indications endorsed by the Japanese Society of Echocardiography European Journal of Echocardiography 12 2011. 167–205. 10.1093/ejechocard/jer021 [DOI] [PubMed] [Google Scholar]
- 15. Mavinkurve-Groothuis AM Marcus KA Pourier M Loonen J Feuth T Hoogerbrugge PM de Korte CL Kapusta L Myocardial 2D strain echocardiography and cardiac biomarkers in children during and shortly after anthracycline therapy for acute lymphoblastic leukaemia (ALL): a prospective study European Heart Journal Cardiovascular Imaging 14 2013. 562–569. 10.1093/ehjci/jes217 [DOI] [PubMed] [Google Scholar]


 This work is licensed under a