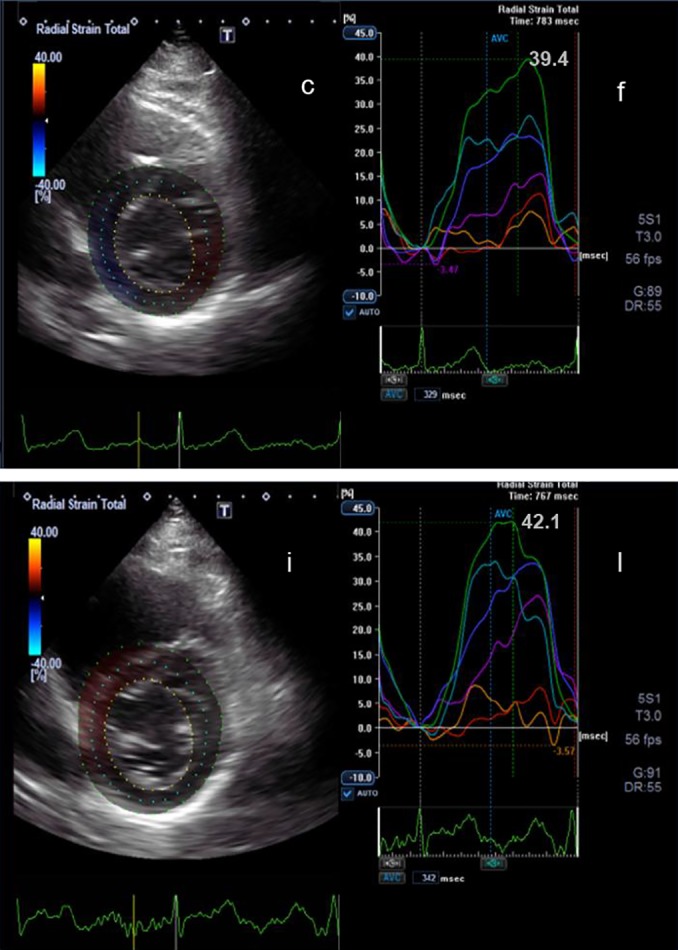
Figure 1.

2D parasternal short axis view at the level of the mitral valve (c) and the corresponding radial strain curves (f) before chemotherapy are shown. Below the corresponding view (i) and radial strain curves (l) during chemotherapy after 3 months are shown. The peak radial strain at the beginning of the chemotherapy is 39.4% and after 3 month is 42.1%.

 This work is licensed under a