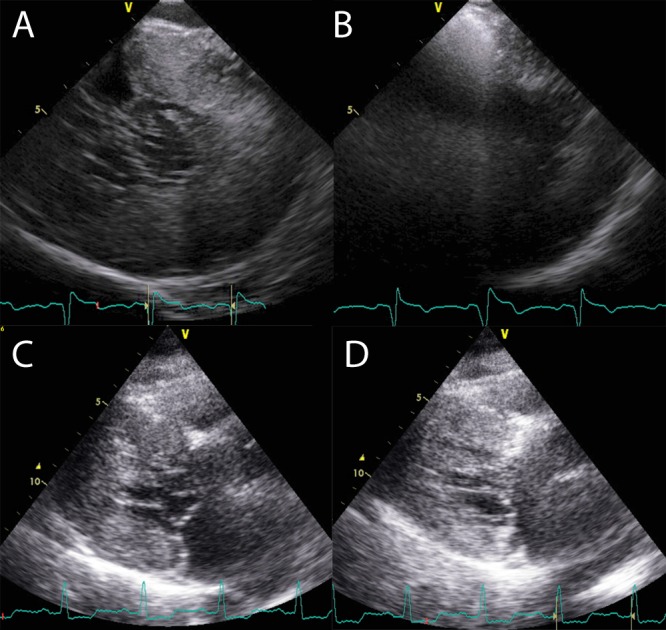
Figure 3.

(A) and (B) show ICE images. (C) and (D) show paired TTE images. (B) and (D) are simultaneous images taken with myocardial contrast injection. There is significant acoustic shadowing seen following contrast injection in the ICE image (B). There is minimal shadowing seen on TTE (D).

 This work is licensed under a