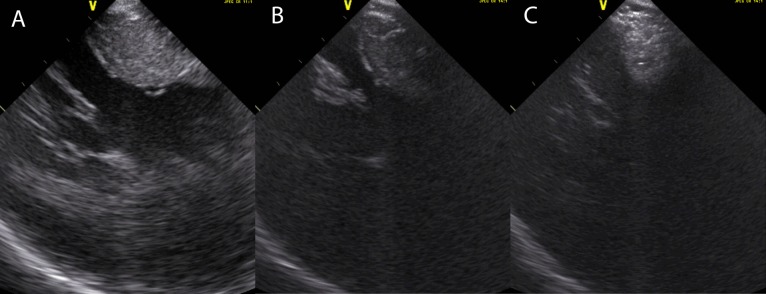
Figure 4.
(A) shows a long-axis ICE view of the left ventricle using a frequency of 11 MHz. (B) shows the same transducer position with a frequency of 5 MHz. (C) shows a myocardial contrast injection at a frequency of 5 MHz. Myocardial contrast is visible in the basal septum in (C), but to allow the operator to see this a reduction in frequencies is required. This degrades the image to the extent that it cannot be relied upon to accurately comment on cardiac anatomy.

 This work is licensed under a