Abstract
Several methods of analysis are available for quantification of left ventricular volumes and ejection fraction using three-dimensional (3D) echocardiography. This study compared the accuracy and reproducibility of five methods of analysis in a novel, irregularly shaped dynamic heart phantom with excellent image quality. Five 3D datasets were acquired on a Philips IE33 platform using an X5-1 3D transducer. Each dataset was analysed by five different methods using the Philips QLab v8.1 software: Methods A1, A2 and A3, semi-automated contour detection with varying degrees of user correction; Method B, Simpson's biplane method using optimally aligned four- and two-chamber views and Method C, method of discs, manually delineated in reconstructed short-axis views. Time–volume curves were generated for each method and compared with the true volumes measured throughout systole in the phantom heart. A second observer repeated measurements by each method in a single 3D dataset. Method A1 (uncorrected semi-automated contouring) produced the most consistent time–volume curves, although end-diastolic and end-systolic volumes varied between datasets. Any manual correction of contours (Methods A2, A3 and B) resulted in significant variation in the time–volume curves, with less consistent endocardial tracking. Method C was not only the most accurate and reproducible method, but also the most time-consuming one. Different methods of 3D volume quantification vary significantly in accuracy and reproducibility using an irregular phantom heart model. Although contouring may appear optimal in long-axis views, this may not be replicated circumferentially, and the resulting measures appeared to be less robust following the manual correction of semi-automated contours.
Keywords: 3D echocardiography, 3D transthoracic echocardiography, left ventricular volume
Introduction
Recent advances in three-dimensional (3D) echocardiography have facilitated assessment of left ventricular (LV) volumes and ejection fraction (1). However, delineation of the entire LV endocardium is necessary in order to obtain accurate measurements (2). The introduction of semi-automated contour finding algorithms has made clinical application of 3D quantification more practical, particularly in high-volume clinical echocardiography laboratories. Several methods of 3D contouring are available using different image orientations, degrees of automation and manual correction of automated contours. Previous studies comparing volumes obtained by 3D echocardiography with magnetic resonance imaging (MRI) have reported reasonable agreement and high levels of reproducibility using several different methods of LV volume calculation (3, 4, 5, 6, 7, 8). However, validation has been performed mainly in cohorts of patients with normal ellipsoid LV shapes and with varying image quality. Furthermore, volumes obtained by echocardiography are frequently lower than those measured by MRI (9). These differences have been attributed in part to echocardiographic image quality, which may variably affect the various methods of 3D quantification.
In our laboratory, we have established a (commercially available) beating heart phantom for performance of 3D echocardiographic studies. This creates ideal conditions to compare several methods for volume measurement by excluding the effects of limited acoustic windows. Additionally, it provides an opportunity to challenge the semi-automated contour finding algorithms by assessment of an irregular/non-ellipsoid ventricle.
This study compared the accuracy and reproducibility of dynamic volume measurements obtained by five different 3D echocardiographic methods in an asymmetric beating heart phantom.
Methods
Dynamic heart phantom
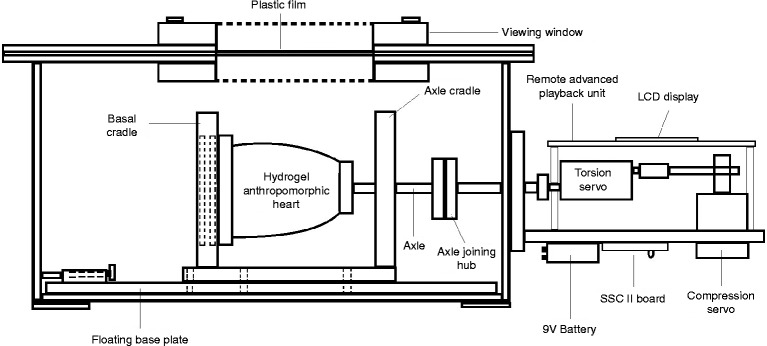
The dynamic heart phantom (Shelley Medical Imaging Technologies, London, Ontario, Canada) consists of a hydrogel anthropomorphic heart attached to a control hub designed to govern its motion, applying both torsional and compressive forces (Fig. 1).
Figure 1.
Side-view schematic of the dynamic heart phantom system; adapted and reproduced with kind permission of Shelley Medical Imaging Technologies.
The heart itself consists of a polyvinyl alcohol-based, anatomically accurate left and right ventricular structure without valves, specifically designed for ultrasound interrogation. The hydrogel material mimics the density and ultrasonic properties of myocardium. The LV cavity shape was designed to resemble that of a patient following a transmural apical myocardial infarction with bulging of the apex in systole. As the heart phantom is made from polyvinyl alcohol, there is only minor change in wall thickness during systole. During its moulding, the material was mixed with graphite for generation of ultrasound speckle and an iodine solution for contrast in cardiac computed tomography.
The heart is centred within a transparent Plexiglass case filled with distilled water. It is fixed to a cradle at its basal end and an axle at the apex, also supported by the cradle. This is mounted on a floating base plate to allow long-axis motion during the cardiac cycle. The axle simulates longitudinal motion (compression) as well as torsion. As ventricular volume changes, fluid within the heart is displaced through two ports at the base. A thin plastic film on the upper surface serves as a scanning window providing short- and long-axis views from a parasternal-like position over the heart. The phantom generates an ECG which is transferred to the 3D scanner through the audio input of the scanner, and the heart rate was 36 beats/min.
Volume measurement
The true ‘resting’ and dynamic volumes of the LV were measured before echocardiographic images were acquired. The anthropomorphic heart was removed from the apparatus, emptied completely and filled to the top of the LV ports using a laboratory measuring cylinder, where the volume of the ports was already known. The resting LV volume was 68.0 ml.
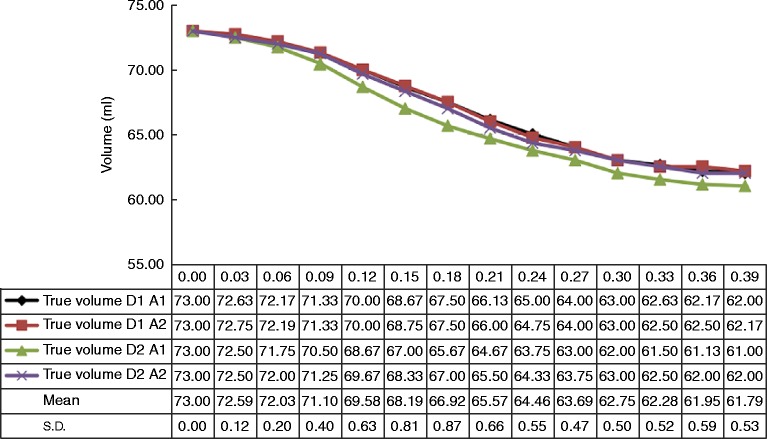
Assessment of dynamic ventricular volumes was made by video measurement of the fluid level in a calibrated measuring tube throughout the cardiac cycle. Measurements were obtained frame by frame (30/s) by visually documenting each volume as indicated by the bottom of the fluid meniscus. The measuring tube was located perpendicular to the ventricle with a gentle curvature between the measuring tube and the ventricle port to minimise any impact on the moving fluid. Two separate recordings were made and each analysed twice, with the resulting mean considered the ‘true’ volume for comparison with echocardiographic measures. Maximum and minimum volumes were 73.0 and 61.8 ml respectively. Direct measures obtained by video were highly reproducible with standard deviation ranging from 0.0 to 0.9 ml throughout systole (Fig. 2). The resolution of volume measurements was 0.25 ml as determined by the scale of the measuring tube, which was scaled in mm (this was tested by injecting 1 ml into the tube, which raised the fluid level by 4 mm). During volume measurements, the possible effect of pressure wave delay was minimised by the very long duration of the cardiac cycle, the relatively small volume changes and the set-up of the apparatus with short and relatively wide tubing from the ventricle to the measuring tube. The parallel course of the calculated volume curves and the volume curves derived from 3D echo (in particular method of discs (MOD)) also support our assumption that there is no significant delay. The resolution of the video camera used was 1920×1080p at 30 frames/s.
Figure 2.
Repeated measures of the true volume throughout systole. D1, dataset 1; D2, dataset 2; A1, analysis 1; A2, analysis 2.
Echocardiographic volume measurements
3D datasets were recorded with a Philips IE33 ultrasound machine (Philips Ultrasound Ltd, Bothell, WA, USA) using an X5-1 3D transducer. The volume rate was set at 20 Hz, depth 17 cm and sector width 80×80 degrees, which allowed inclusion of the entire heart in the 3D volume set. Gain, compression and time gain compensation were optimised to provide similar signal intensities at all depths and to reduce echoes from the fluid. Before performing the measurements, a protocol was agreed upon by both readers, which follows the ASE guidelines for both 2D and 3D LV volume measurements. Reader 1 was a novice reader with 6 months experience using QLAB on the phantom datasets before performing the analysis of this study, whereas reader 2 has 30 years of experience in 2D echocardiography and 10 years in 3D echocardiography. As there are no valves in our phantom model, a consensus was reached between the readers that the mitral border would be the slice void of any traceable area. Acquisition was performed using a full volume setting to create a single-beat dataset by ‘stitching’ of four sub-volumes. Datasets were analysed off-line using a commercially available software application (Philips QLAB v8.1) specifically designed for clinical 3D dataset processing. This application has two sub-programs for analysis of 3D datasets for measurement of LV volumes: 3DQ and 3DQadv.
Ventricular volumes were measured using datasets obtained from five separate 3D echocardiographic acquisitions performed at different positions within the phantom viewing window. These datasets were acquired consecutively every 1–2 min with the dynamic phantom running continuously. The volume measurements using the measurement tube were not performed simultaneously with the 3D acquisition for practical reasons, as the true volume measurements were highly reproducible in time and volume. No trigger was used. However, the pumps always started at the same LV volume, which was verified during the reproducibility measurements. By taking the true volume measurements at the same time-points of the echo measurements, the corresponding volumes could be matched. Five different methods of analysis (Methods A1, A2, A3, B and C; see Table 1) were then carried out by a single observer for each acquisition. Volumes were calculated by each method at 0.04–0.05 s intervals as determined by the analysis software, during the time from maximum to minimum cavity size. These were compared with volumes measured by video using frames obtained at the corresponding phase of the phantom cardiac cycle. A second observer (reader 2) repeated measures by each method using data from the first echocardiographic acquisition. In order to limit the amount of data to be analysed, only the systolic phase of the cardiac cycle was used. This provided the maximum range of volumes.
Table 1.
Summary of 3D analysis methods
| A1 | Semi-automated volumetric method without manual correction |
| A2 | Semi-automated volumetric method with manual correction of end-diastolic and end-systolic contours before processing the 3D dataset |
| A3 | Semi-automated volumetric method with manual correction in all frames after processing the 3D dataset |
| B | Simpson's biplane method of discs on optimised orthogonal 2D planes of a 3D dataset |
| C | 3D method of discs technique using short-axis slices |
2D, two-dimensional; 3D, three-dimensional.
3D semi-automated contour finding (Methods A1, A2 and A3)
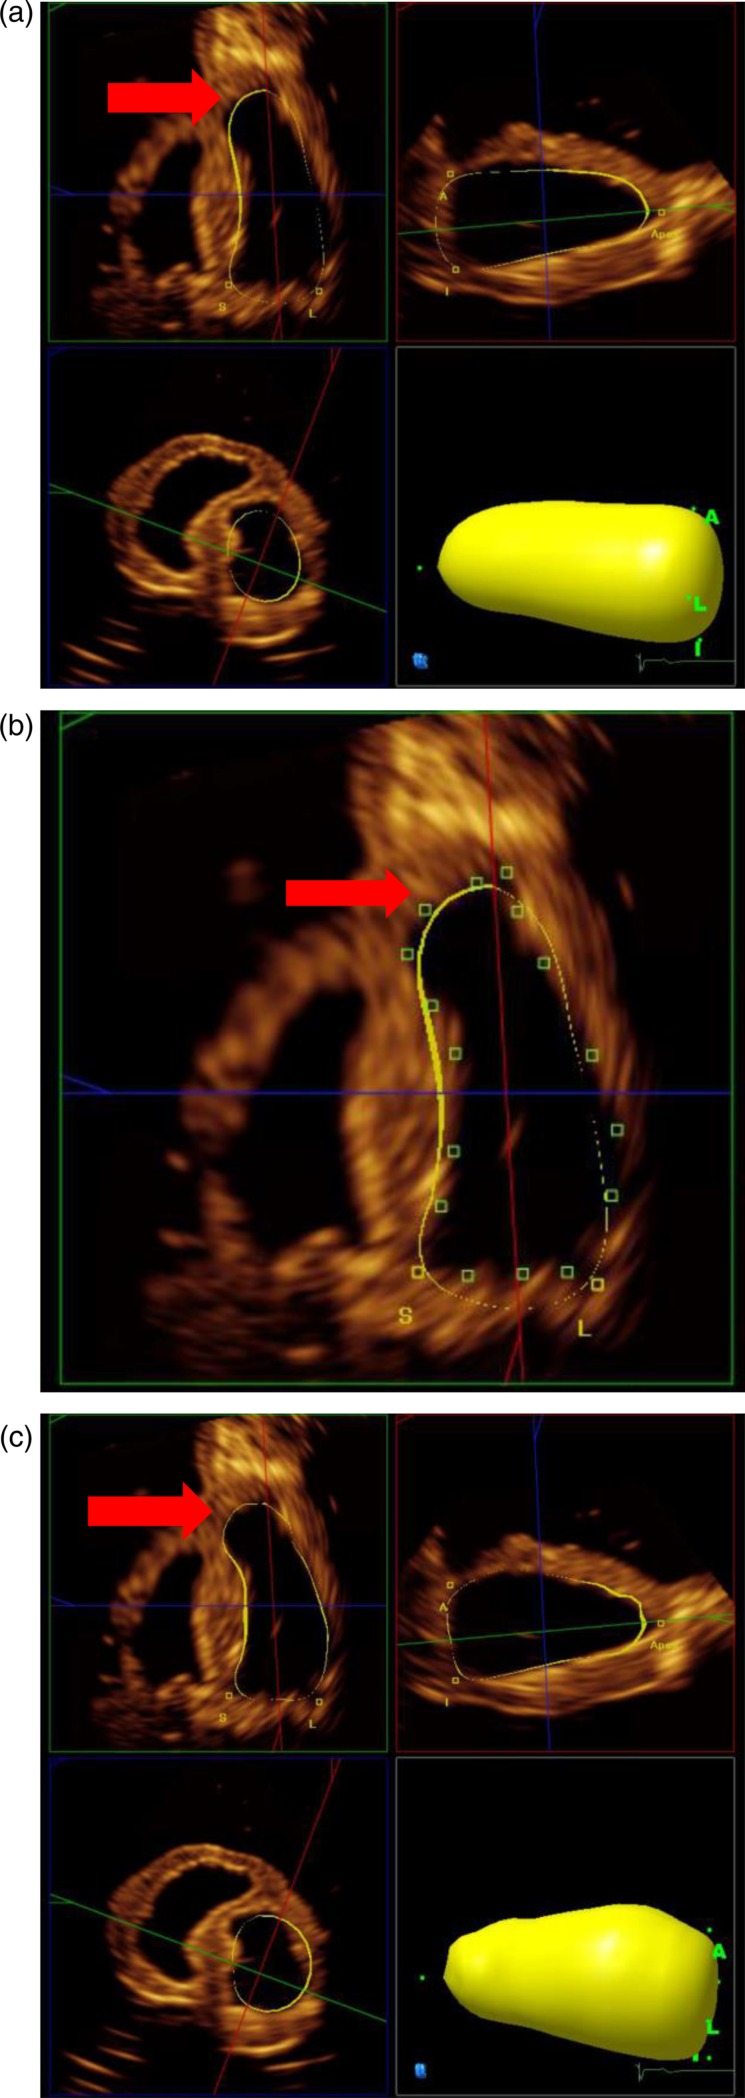
The sub-program 3DQadv was used for semi-automated identification of LV borders. On a quad screen display, the upper quadrants represent orthogonal 2D planes of the 3D dataset corresponding to the four- and two-chamber views (Fig. 3). Both views were optimised using the visibly longest length of the phantom LV in both views. In sub-program 3DQ, it is possible to quantify the length to increase the accuracy for finding the true long axis, but not in 3DQadv.
Figure 3.
(a) Quad screen displaying the results of Method A1 after placing markers at the base and the apex of the long-axis views, which initiates the calculation of the LV volume (yellow shell). The contour is displayed in three orthogonal planes including a short-axis plane (b). After completing Method A1, corrections of the contour can be carried out (Method A2), and this is demonstrated on the four-chamber view; the green markers indicate points of manual correction and the results are shown in section (c). The correction resulted in a better alignment of the apical bulge (arrow). However, it can be seen in the mid-short-axis view that the derived contour still deviates from the endocardial contour.
For Method A1, semi-automated contour finding was applied without manual correction of the contours. Long-axis orientation was optimised to display non-foreshortened orthogonal 2D planes by aligning the centre of the mitral annulus with the true cardiac apex in both views. Landmarks were positioned at the mitral annulus in each long-axis view, and one at the apex to initiate the endocardial contour finding algorithm. This was performed in end-diastole and end-systole (determined by maximum and minimum cavity sizes) and sequence analysis performed to generate a time–volume curve, with interpolated volumes calculated for each frame throughout systole. The results are displayed as a 3D ‘shell’ view of the ventricle with corresponding borders that can be interrogated in the long-axis views.
For Method A2, the long-axis planes were optimised as described previously. Following initial semi-automated contouring in end-diastole, the long axis contours were manually corrected a maximum of twice if they did not accurately follow the endocardium. The same process was repeated for the end-systolic frame before sequence analysis was performed.
For Method A3, sequence analysis was performed following semi-automated contouring as in Method A1. The interpolated long-axis contours were then corrected at each frame throughout the cardiac cycle from end-diastole to end-systole, generating a time–volume curve with corrected contours at each point.
2D MOD from 3D dataset (Method B)
Simpson's MOD is the standard technique for assessing volumes in 2D echocardiography, but can also be applied with 2D images reconstructed from a 3D dataset using the sub-program 3DQ (Fig. 4). Measures are obtained from orthogonal sections through the ventricle representing standard four- and two-chamber views (1). Foreshortening was avoided by aligning with the true apex, such that LV length was equivalent in both views. Measurements were performed according to established guidelines (1, 10, 11) by placing markers at the mitral annulus and the apex. A provisional ventricle-shaped contour is deployed, which in most cases required manual adjustment to trace the endocardium. Volume is calculated automatically by summing the sub-volumes of a stack of 20 discs from base to apex. An ellipsoid shape is assumed for each disc with diameters derived from ventricular width in the long-axis views. A measurement was performed at every time-point between the largest and smallest volumes with small adjustments as necessary.
Figure 4.
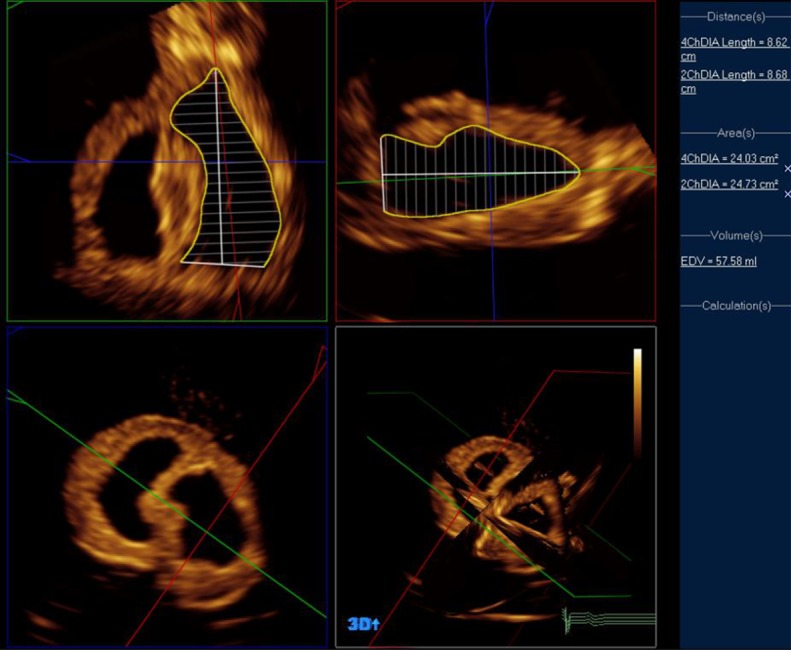
Method B – Simpson's biplane method using Philips QLAB 3DQ in a three-dimensional dataset.
The purpose of this paper was to compare all the commonly used methods for volume calculation in echocardiography. The 2D MOD has been used in clinical studies previously. It may be considered illogical to acquire a 3D volume only to disregard the majority of the data. The advantage of this technique is to perform segmentation of the LV on unforeshortened orthogonal 2D views, which can be created from 3D datasets. This approach takes less time than processing the entire dataset and provides results comparable to more complex 3D methods (12).
3D MOD (Method C)
The sub-program 3DQ also allows volume measurements from short-axis views using an application called iSlice. This divides the 3D dataset into 16 short-axis slices in which the endocardial borders are traced manually (Fig. 5). These were aligned perpendicular to the true long axis, with the outer slices placed just beyond the limits of the LV cavity to ensure that the entire volume was contained. The LV length was measured as the distance from slices 1–16, and the total volume was calculated from the sum of the 14 intervening slices.
Figure 5.
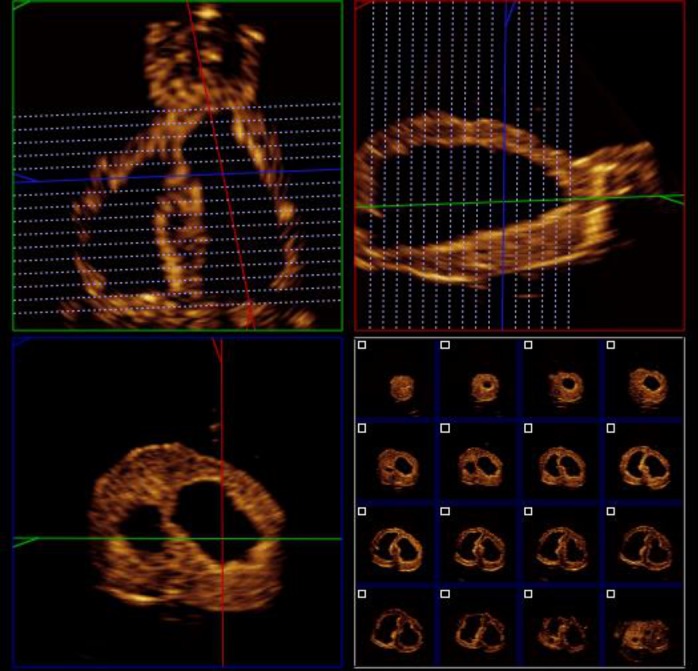
Method C – the iSlice tool (Philips QLAB v8.1 software) was used to reconstruct short-axis slices, which can be manually delineated.
Results
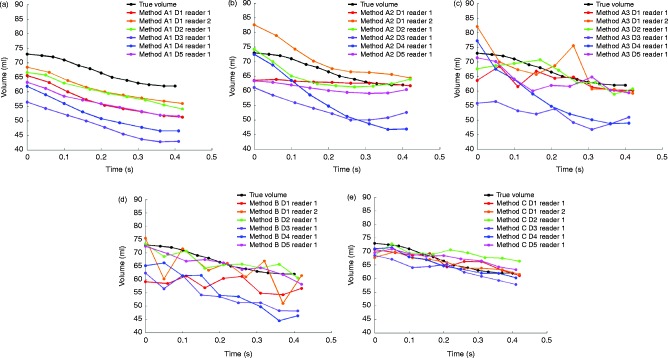
Excellent quality images were obtained in all five 3D acquisitions without significant echo dropout. Time–volume curves are presented displaying the volumes calculated by each method through systole, compared with the true volume (Fig. 6).
Figure 6.
(a) Time–volume curves obtained by each method: A1 (a), A2 (b), A3 (c), B (d) and C (e) repeated for each of the five different datasets (D1–D5).
The mean±s.d. of the end-diastolic volume (EDV) and end-systolic volume (ESV) for the true volumes and the five methods are presented in Table 2. The best agreement between true volumes and volumes obtained by 3D echo are found by Method C.
Table 2.
Mean±s.d. of end-diastolic, end-systolic and left ventricular ejection fraction calculations of the true volumes and the five 3D echocardiographic methods
| EDV | ESV | |
|---|---|---|
| True volumes | 73.0±0.0 | 61.8±0.5 |
| Method A1 | 63.7±4.3 | 50.4±4.8 |
| Method A2 | 69.6±8.3 | 58.3±7.0 |
| Method A3 | 71.4±9.8 | 57.0±4.8 |
| Method B | 68.0±6.7 | 55.2±6.4 |
| Method C | 70.1±2.0 | 61.4±2.3 |
EDV, end-diastolic volume; ESV, end-systolic volume.
The time–volume curves demonstrate that the uncorrected semi-automated contours (Method A1, Reader 1) followed the true volumes most reliably through systole. Initial variability in semi-automated contouring resulted in a range of values of 10.2 ml in diastole (EDV) and 11.1 ml in systole (ESV) over the five acquisitions. However, contour tracking through systole was generally consistent with calculated stroke volumes varying by only 2.6 ml – ranging from 11.7 to 14.3 ml, compared with a true stroke volume of 11.2 ml.
Any manual correction introduced significant variability in endocardial tracking. Using Method A2 (Reader 1), the range of EDV (13.1 ml) and ESV (17.1 ml) is greater than that with the uncorrected contours. The contour tracking is also less consistent resulting in a much wider distribution of calculated stroke volumes, in the range of 23.7 ml (from 1.9 to 25.6 ml). A similar result is noted for Method A3 (Reader 1), with a significant variability resulting from frame-by-frame correction of long-axis contours. Some of the analyses performed by this method demonstrate fluctuating volumes and do not follow the gradual decline in the true volume curve. A broad range of EDV and ESV (15.6 and 11.7 ml respectively) is reflected in the broad distribution of calculated stroke volumes, varying by 24.8 ml (from 3.4 to 28.2 ml).
Similar results were also obtained using 3D Simpson's biplane method with corrected long-axis contours (Method B, Reader 1). Calculated EDV varied by 14.2 ml, ESV by 14.3 ml and stroke volume by 16.3 ml. Method C (short-axis MOD, Reader 1) was by far the most consistent method for calculating EDV with the values consistent within 2.4 ml compared with 8.6 ml for ESV. Calculated volumes were also the most accurate compared with the true volumes. The variation in ESV is reflected in the range of stroke volumes (8.6 ml, from 2.1 to 10.7 ml), which is higher than using the uncorrected semi-automated contours (Method A1), but lower than any of the other manually corrected methods.
For each of the analysis methods, the results are replicated in time–volume curves obtained by reader 2. Semi-automated contours without manual correction (Method A1) closely follow the stroke volume curve. Adjustment of the initial contours (Method A2) causes deviation, particularly due to increased error in EDV, and frame-by-frame correction (Method A3) results in a fluctuating time–volume curve. By Simpson's biplane method (Method B), the EDV and ESV are actually close to the true volumes; however, difficulty with contour tracking is evident with marked fluctuation of the time–volume curve. The curve obtained by Method C is close to the true volume curve and similar to that of reader 1.
Discussion
The main finding of this study is that, under the given experimental conditions using an asymmetric LV with good image quality, the 3D MOD (Method C) was the most accurate and consistent method for calculating true volumes when compared with the other available 3D echocardiographic methods.
With excellent image quality obtained using a phantom heart, the semi-automated algorithms are limited in their contouring of an asymmetric ventricular shape. Uncorrected contours appeared to be the most consistent at tracking systolic motion. While the process of manual correction appears to improve delineation in long-axis views, differences arising from correction around the remaining endocardium result in an increased variability.
The phantom heart provides a basis for the assessment of ultrasound techniques and analysis methods in a controlled setting. To our knowledge, this is the first study using a dynamic phantom heart for 3D echocardiographic volume measurement with widely used, commercially available methods for LV assessment.
Previous studies have tested 3D imaging techniques using static phantom models to assess the accuracy of volume measurements and to determine associated sources of error (13, 14). These phantoms were egg or balloon shaped, comprised of Zerdine and Latex, and a simple ellipsoid shape. Levels of accuracy and reproducibility reported in these studies were high, and this has also been demonstrated in clinical studies using similar techniques (3, 5, 6, 7). To examine the effect of border definition using ultrasound, Mor-Avi et al. assessed volume differences measured from short-axis images of a balloon phantom of known volume (150 ml). The middle border was most accurate (148 ml), with volumes obtained from the inner and outer volumes varying by 57 ml (13). However, the acoustic properties of myocardium (and the dynamic heart phantom) probably differ from a balloon phantom and, in this study, the inner border was traced in keeping with usual clinical practice.
Evaluating the accuracy of a contour finding algorithm requires a ventricle that changes in shape and volume during the cardiac cycle. While the true volume changes observed in this study were smaller than that would be observed in the clinical setting, even in a severely impaired ventricle, the primary aim of the study was to challenge the contour finding algorithms by simulating change in shape of an asymmetric or irregular ventricle.
Some issues were apparent at several stages of contouring and analysis. As a first step, orthogonal planes are used to define long-axis views through the true apex (Fig. 3). While this can usually be assessed visually, it may be more difficult to do so in the context of an apical abnormality such as an aneurysm. In such cases, precision can be improved by confirming equivalent ventricular length in the orthogonal long-axis views, which was not possible with the available software.
Following initial placement of ventricular landmarks to guide the algorithm, the initial contour frequently deviated from the apical marker. The software manufacturer advises placement within the apical myocardium to allow accurate contouring. Identification of the basal ventricular landmarks appeared less problematic.
The endocardial contours provided by the semi-automated algorithm can be corrected manually in several different ways and repeated at intervals in the cardiac cycle. Despite this, optimal fitting of recalculated contours to the endocardial borders was not observed in the heart phantom, and the contours did not always correspond to desired points from the manual correction. In particular, short-axis views demonstrated a persistently ellipsoid contour deviating from the endocardial circumference, implying that the algorithm is limited in its ability to follow irregular borders despite correction. For the reproducibility measurements, the dataset was completely reset and the readers had to reselect the 2D planes for initialisation of the volume measurements. This creates an error because of the lack of symmetry of the phantom; an apical aneurysm makes it difficult to determine a distinct apex. Under these conditions, there is variability where the apical marker is placed. This is quite different from normal LVs.
The 3D MOD was the most accurate and reproducible measure in the current study. This method is analogous to the accepted standard for calculation of LV volumes in cardiac MRI (15). The results reflect those of previous studies – using static phantoms with LV aneurysms of varying morphology, Buck et al. (16) found that volume measures obtained by the manually contoured 3D MOD were more accurate (bias 1 ml, −11.6 to +13.4 ml) than those obtained by 2D Simpson's biplane method (bias 9 ml, −33.8 to +49.4 ml). In a further patient population with LV aneurysms, the limits of agreement for EDV were smaller using the MOD (−39.7 to +18.4 ml) compared with Simpson's biplane method (−89.4 to +73.4 ml) (17). It may be intuitive that manual delineation in short axis at multiple levels is superior to more limited tracing in long-axis views, particularly when relevant geometric assumptions cannot be made. It also follows that the MOD is the most time-consuming measurement, taking an average of 12 min/3D dataset in this study. In comparison, using the semi-automated algorithm takes ∼3 min with interpolated volumes throughout the cardiac cycle. However, the additional time taken for analysis from short-axis images is routine for LV volume and functional assessment in MRI.
Despite optimal imaging conditions, there were remarkable differences between true volumes and echocardiographically measured volumes. The differences between the true volumes and the volumes measured by Method A1 range between 4.5 and 16.5 ml for the EDV and 6 and 19 ml for the ESV. Better agreement was found for the 3D MOD with 2.0–4.4 ml for EDVs and 1.3–4.2 ml for ESVs. The larger differences observed for Method A1 are most probably due to the fact that the 3D volume calculation algorithm cannot completely align with the asymmetric ventricular border. Previous phantom studies have also shown differences between the true volume and the echocardiographically measured volume depending on where the contour was placed (13). By tracing the contour just inside the endocardial border, we might have caused a slight underestimation of the true volume.
It should be noted that, in this study, the whole heart phantom could be included in the 3D dataset from the scanning window. In the clinical setting, the cardiac apex is usually not well seen from the parasternal long-axis view meaning the superiority of this method may not be replicated, particularly in the context of a significant apical abnormality. The set-up with a parasternal window provides more perpendicular imaging of the LV borders compared with images from the apex. However, the high image quality also translates to the reconstructed long-axis views, which had very clear borders compared with those obtained from apical views in humans. As demonstrated in Fig. 3, the discrepancies between the true volumes and volumes obtained by Methods A1, A2 and A3 are most probably because the algorithm cannot follow the endocardial border and this can be observed in the short-axis views as well. In practice, 3D images for volume measurement are standardly obtained from apical views. As such, endocardial definition from reconstructed short-axis views is limited even in patients with very good image quality. However, methods that demonstrate the potential for improvement do exist: the facility to alter slice thickness, increasing experience with the use of contrast agents, and even fusion of echocardiographic datasets (3, 18, 19, 20) may improve image quality and 3D reconstruction in the coming years. With further development of accurate short-axis contour finding algorithms, the true 3D MOD, as currently used in cardiac MRI, may yet become a practical clinical application in echocardiography.
Study limitations
The dynamic heart phantom was designed to allow accurate comparison of analysis techniques in a controlled setting by eliminating discrepancies due to image quality. Despite excellent image quality in all acquisitions, there are some inherent limitations to the use of a dynamic phantom that should be acknowledged. It has previously been noted that images were acquired from an equivalent parasternal rather than apical view. The phantom itself was of relatively small volume compared with that of an aneurysmal ventricle, and the resulting volume changes and ejection fraction were significantly lower than would normally be observed in the clinical setting. Unfortunately, the current version of the heart phantom provides only one shape; as a result, this study was unable to test its methods in ventricles of different sizes and shapes. This study was also designed to assess the semi-automated contour finding algorithm in the context of an aneurysmal apex; therefore, the results may not apply to more regularly shaped ventricles. In living hearts, the endocardial borders are less well defined compared with the heart phantom and, therefore, accurate boundary placement is more difficult which may worsen the variability of measurements.
Observer variability was only provided using a second reader (inter-observer). However, including the repeated measures of Reader 1 would not add anything to the overall findings of the study. This is due to the inherent high reproducibility of the phantom and the fact that five datasets had already been analysed by the first reader. Furthermore, with the variability of the results in the test–retest methodology demonstrated for the semi-automatic methods, it was felt that an intra-observer variability would not affect the study conclusions.
Conclusion
In a dynamic heart phantom with optimal image quality, different methods of 3D volume quantification varied significantly in their accuracy and ability to track the endocardial contour through systole. Measures using semi-automated methods appeared less robust following manual correction – this probably relates to constraints within the contour finding algorithms, which were particularly challenged by the shape of the phantom heart in this study. The 3D MOD, using manually drawn contours from short-axis slices, was the most accurate and reproducible method but also the most time consuming.
Declaration of interest
The authors declare that there is no conflict of interest that could be perceived as prejudicing the impartiality of the research reported.
Funding
H Becher has received financial support through an endowed chair of the Heart and Stroke Foundation of Alberta, Northwest Territories and Nunavut. P Wood receives a salary from the endowment.
Author contribution statement
P Wood performed the experiments, analysed the data and contributed to writing. P Gibson contributed in analysing the data and writing the manuscript. H Becher supervised the project and contributed to the data analysis and writing.
References
- 1. Lang RM Badano LP Tsang W Adams DH Agricola E Buck T Faletra FF Franke A Hung J de Isla LP et al. EAE/ASE recommendations for image acquisition and display using three-dimensional echocardiography European Heart Journal Cardiovascular Imaging 13 2012. 1–46. 10.1093/ehjci/jer316 [DOI] [PubMed] [Google Scholar]
- 2. Leung KY Bosch JG Automated border detection in three-dimensional echocardiography: principles and promises European Journal of Echocardiography 11 2010. 97–108. 10.1093/ejechocard/jeq005 [DOI] [PubMed] [Google Scholar]
- 3. Jenkins C Moir S Chan J Rakhit D Haluska B Marwick TH Left ventricular volume measurement with echocardiography: a comparison of left ventricular opacification, three-dimensional echocardiography, or both with magnetic resonance imaging European Heart Journal 30 2009. 98–106. 10.1093/eurheartj/ehn484 [DOI] [PubMed] [Google Scholar]
- 4. Shimada YJ Shiota T A meta-analysis and investigation for the source of bias of left ventricular volumes and function by three-dimensional echocardiography in comparison with magnetic resonance imaging American Journal of Cardiology 107 2011. 126–138. 10.1016/j.amjcard.2010.08.058 [DOI] [PubMed] [Google Scholar]
- 5. Caiani EG Corsi C Zamorano J Sugeng L MacEneaney P Weinert L Battani R Gutierrez JL Koch R Perez de Isla L et al. Improved semiautomated quantification of left ventricular volumes and ejection fraction using 3-dimensional echocardiography with a full matrix-array transducer: comparison with magnetic resonance imaging Journal of the American Society of Echocardiography 18 2005. 779–788. 10.1016/j.echo.2004.12.015 [DOI] [PubMed] [Google Scholar]
- 6. Coon PD Pollard H Furlong K Lang RM Mor-Avi V Quantification of left ventricular size and function using contrast-enhanced real-time 3D imaging with power modulation: comparison with cardiac MRI Ultrasound in Medicine & Biology 38 2012. 1853–1858. 10.1016/j.ultrasmedbio.2012.07.001 [DOI] [PubMed] [Google Scholar]
- 7. Corsi C Lang RM Veronesi F Weinert L Caiani EG MacEneaney P Lamberti C Mor-Avi V Volumetric quantification of global and regional left ventricular function from real-time three-dimensional echocardiographic images Circulation 112 2005. 1161–1170. 10.1161/CIRCULATIONAHA.104.513689 [DOI] [PubMed] [Google Scholar]
- 8. Jacobs LD Salgo IS Goonewardena S Weinert L Coon P Bardo D Gerard O Allain P Zamorano JL de Isla LP et al. Rapid online quantification of left ventricular volume from real-time three-dimensional echocardiographic data European Heart Journal 27 2006. 460–468. 10.1093/eurheartj/ehi666 [DOI] [PubMed] [Google Scholar]
- 9. Wood PW Choy JB Nanda NC Becher H Left ventricular ejection fraction: it depends on the imaging method Echocardiography 31 2014. 87–100. 10.1111/echo.12331 [DOI] [PMC free article] [PubMed] [Google Scholar]
- 10. Lang RM Bierig M Devereux RB Flachskampf FA Foster E Pellikka PA Picard MH Roman MJ Seward J Shanewise JS et al. Recommendations for chamber quantification: a report from the American Society of Echocardiography's Guidelines and Standards Committee and the Chamber Quantification Writing Group, developed in conjunction with the European Association of Echocardiography, a branch of the European Society of Cardiology Journal of the American Society of Echocardiography 18 2005. 1440–1463. 10.1016/j.echo.2005.10.005 [DOI] [PubMed] [Google Scholar]
- 11. Lang RM Bierig M Devereux RB Flachskampf FA Foster E Pellikka PA Picard MH Roman MJ Seward J Shanewise J et al. Recommendations for chamber quantification European Journal of Echocardiography 7 2006. 79–108. 10.1016/j.euje.2005.12.014 [DOI] [PubMed] [Google Scholar]
- 12. Hoffmann R von Bardeleben S ten Cate F Borges AC Kasprzak J Firschke C Lafitte S Al-Saadi N Kuntz-Hehner S Engelhardt M et al. Assessment of systolic left ventricular function: a multi-centre comparison of cineventriculography, cardiac magnetic resonance imaging, unenhanced and contrast-enhanced echocardiography European Heart Journal 26 2005. 607–616. 10.1093/eurheartj/ehi083 [DOI] [PubMed] [Google Scholar]
- 13. Mor-Avi V Jenkins C Kühl HP Nesser H Marwick T Franke A Ebner C Freed BH Steringer-Mascherbauer R Pollard H et al. Real-time 3-dimensional echocardiographic quantification of left ventricular volumes: multicenter study for validation with magnetic resonance imaging and investigation of sources of error JACC. Cardiovascular Imaging 1 2008. 413–423. 10.1016/j.jcmg.2008.02.009 [DOI] [PubMed] [Google Scholar]
- 14. Herberg U Brand M Bernhardt C Trier HG Breuer J Variables influencing the accuracy of 2-dimensional and real-time 3-dimensional echocardiography for assessment of small volumes, areas, and distances Journal of Ultrasound in Medicine 30 2011. 899–908. [DOI] [PubMed] [Google Scholar]
- 15. Hundley WG Bluemke D Bogaert JG Friedrich MG Higgins CB Lawson MA McConnell MV Raman SV van Rossum AC Flamm S et al. Society for Cardiovascular Magnetic Resonance guidelines for reporting cardiovascular magnetic resonance examinations. Journal of Cardiovascular Magnetic Resonance. 2009;11:5. doi: 10.1186/1532-429X-11-5. [DOI] [PMC free article] [PubMed] [Google Scholar]
- 16. Buck T Schon F Baumgart D Leischik R Schappert T Kupferwasser I Meyer J Gorge G Haude M Erbel R Tomographic left ventricular volume determination in the presence of aneurysm by three-dimensional echocardiographic imaging. I: asymmetric model hearts Journal of the American Society of Echocardiography 9 1996. 488–500. 10.1016/S0894-7317(96)90120-0 [DOI] [PubMed] [Google Scholar]
- 17. Buck T Hunold P Wentz KU Tkalec W Nesser HJ Erbel R Tomographic three-dimensional echocardiographic determination of chamber size and systolic function in patients with left ventricular aneurysm: comparison to magnetic resonance imaging, cineventriculography, and two-dimensional echocardiography Circulation 96 1997. 4286–4297. 10.1161/01.CIR.96.12.4286 [DOI] [PubMed] [Google Scholar]
- 18. Szmigielski C Rajpoot K Grau V Myerson SG Holloway C Noble JA Kerber R Becher H Real-time 3D fusion echocardiography JACC. Cardiovascular Imaging 3 2010. 682–690. 10.1016/j.jcmg.2010.03.010 [DOI] [PubMed] [Google Scholar]
- 19. Rajpoot K Grau V Noble JA Szmigielski C Becher H Multiview fusion 3-D echocardiography: improving the information and quality of real-time 3-D echocardiography Ultrasound in Medicine & Biology 37 2011. 1056–1072. 10.1016/j.ultrasmedbio.2011.04.018 [DOI] [PubMed] [Google Scholar]
- 20. Rajpoot K Grau V Noble JA Becher H Szmigielski C The evaluation of single-view and multi-view fusion 3D echocardiography using image-driven segmentation and tracking Medical Image Analysis 15 2011. 514–528. 10.1016/j.media.2011.02.007 [DOI] [PubMed] [Google Scholar]


 This work is licensed under a