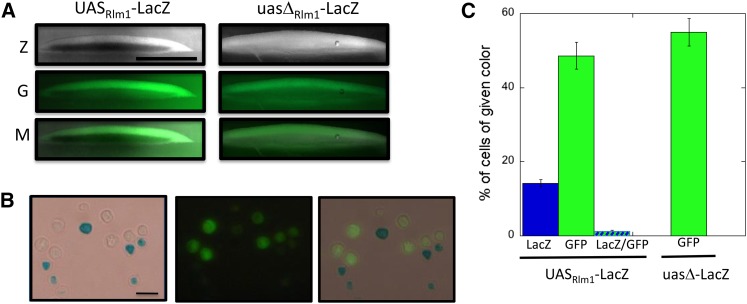
Figure 3.
ime2-GFP expression and Rlm1activation occur in separate colony regions and populations. (A) Section of 6-day ime2Δ-GFP UASRlm-lacZ colony (left, SH5065) and ime2Δ-GFP uasΔ-lacZ colony (right, SH5067) overlaid with X-gal agar (see Materials and Methods). Z = LacZ expression (dark region in left image corresponds to blue region of colony); G = GFP; and M = merge of Z and G images. Scale bar, 500 μm. (B) Cells resuspended from ime2Δ-GFP UASRlm-lacZ spot colony as in A except with 230 μg/ml X-gal and DMF and SDS omitted from overlay agar. LacZ (left), GFP (center), and overlays (right). Scale bar, 10 μm. (C) Quantification of percentage of cells in colonies as in B expressing GFP and/or LacZ in the same strains; cells were scored by light/fluorescence microscopy (n = 3).

