Figure 5.
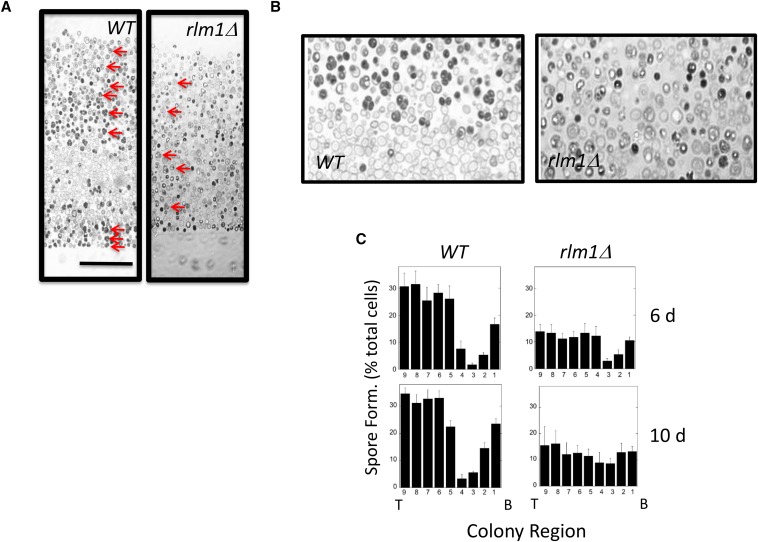
Patterns of sporulation and RLM1 expression in colonies. (A) Central region of a section from 10-day RLM1+ (wild type, SH3881) and rlm1Δ (SH4767) colonies. Arrows point out representative asci in both sections. Scale bar, 50 μm. (B) Higher-magnification image of the central region in the image shown in A. (C) Distribution of sporulated cells in RLM1+ and rlm1Δ colonies at the indicated times. To determine this distribution, a grid containing nine equal-sized rectangles stacked on top of one the other (long side horizontal) was superimposed on each section and scaled to just cover the central region of the colony from bottom to top. Distributions show the percentage of the population recognized as asci in each region of the colony from the bottom (B, left) to top (T, right) of the colony. Each distribution shows mean percentage sporulation for four or more colonies.

