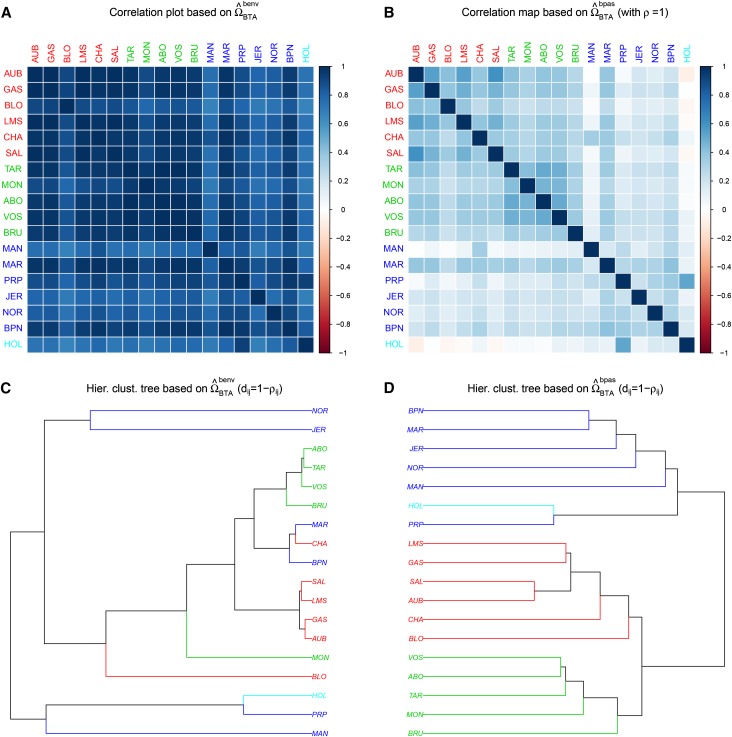
Figure 2.
(A–D) Representation of the scaled covariance matrices among 18 French cattle breeds (A and C) estimated from BayEnv2 (Coop et al. 2010) and (B and D) estimated from BayPass under the core model with Both estimates are based on the analysis of the BTAsnp data set consisting of 42,036 autosomal SNPs (see the main text). Breed codes (and branches) are colored according to their broad geographic origins (see File S4 and Gautier et al. 2010b for further details) with populations in red, blue, and green originating from southwestern and central France, northwestern France, and eastern France (e.g., The Alps).

