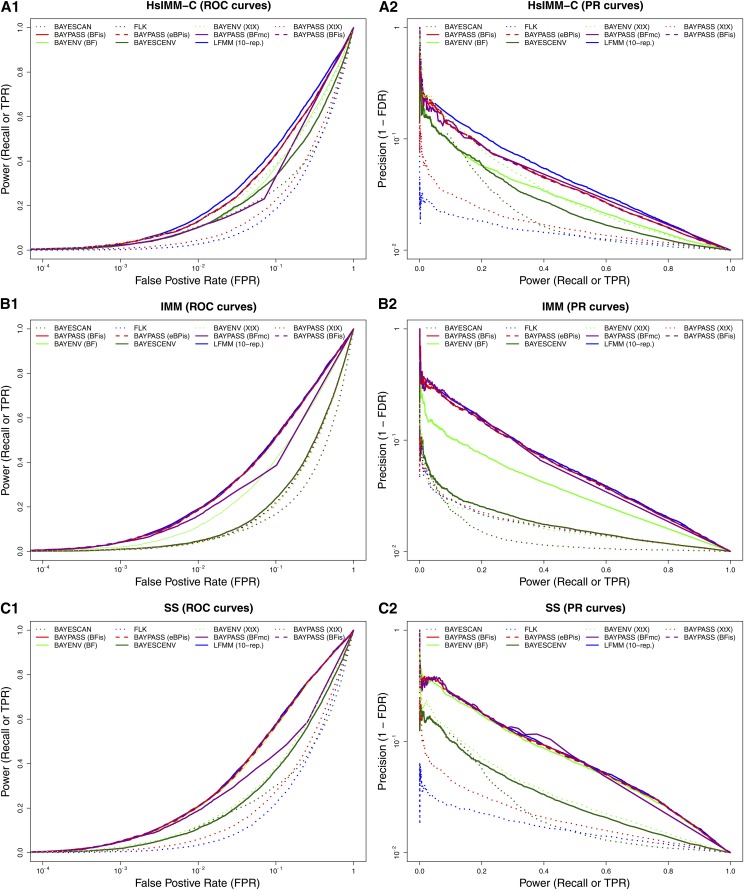
Figure 5.
(A–C) Comparison of the performances of BayPass with other genome-scan methods based on data simulated under the HsIMM-C (A1 and A2), the IMM (B1 and B2) and the SS (C1 and C2) scenarios that include polygenic selection. For each scenario, ROC and PR curves corresponding to the different approaches (and decision criteria) were plotted from the actual TPR, FPR, and FDR estimates averaged over the results of 100 independent data sets.

