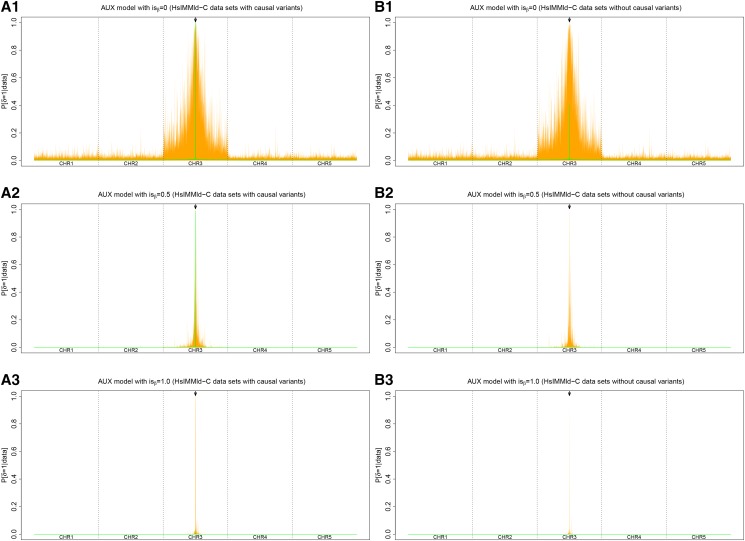
Figure 6.
(A and B) Comparison of the performances of three different Ising prior parameterizations for the AUX model ( and ) on the HsIMMld-C simulated data sets with (A1–A3) and without (B1–B3) the causal variants. Each panel summarizes the distribution at each SNP position (x-axis) of the (auxiliary variable) posterior means over the 100 independent simulated data sets with the median values in green and the 95% envelope in orange. Each simulated data set consisted of 5000 SNPs spread on five chromosomes of 4 cM. In the middle of the third chromosome (indicated by an arrow), a locus with a strong effect on individual fitness was defined by two consecutive SNPs strongly associated with the environmental covariable.

