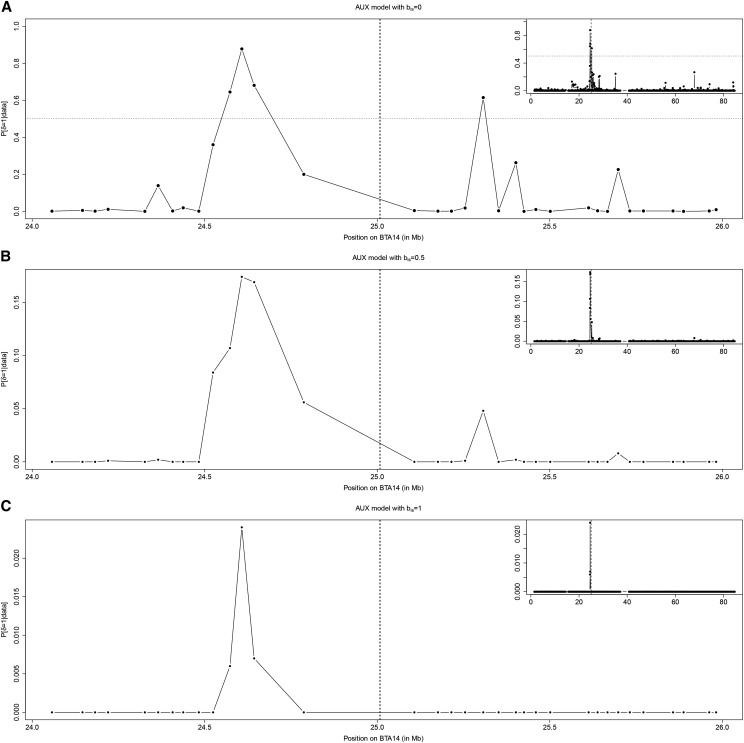
Figure 7.
(A–C) Results of the BTA14 chromosome-wide association analyses with SMS under three different Ising prior parameterizations of the AUX model: (A) (B) and (C) Plots give, for each SNP, the posterior probability of being associated () according to their physical position on the chromosome. The main plot focuses on the region surrounding the candidate gene PLAG1 (positioned on the vertical dotted line) while results over the whole chromosome are represented in the top left inset. In A, the horizontal dotted line represents the threshold for decisive evidence (corresponding to dB).

