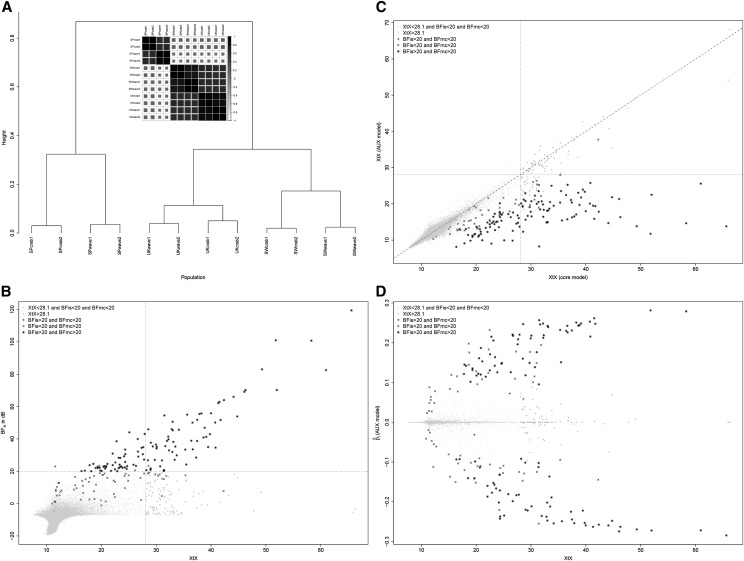
Figure 8.
Analysis of the LSAps Pool-Seq data. (A) Inferred relationship among the 12 Littorina populations represented by a correlation plot and a hierarchical clustering tree derived from the matrix estimated under the core model (with ). Each population code indicates its geographical origin (SP, Spain; SW, Sweden; and UK, United Kingdom), its ecotype (crab or wave), and the replicate number (1 or 2). (B) SNP XtX (estimated under the core model) as a function of the for association with the ecotype population covariable. The vertical dotted line represents the 0.1% POD significance threshold (XtX = 28.1) and the horizontal dotted line represents the 20-dB threshold for BF. The point symbol indicates significance of the different XtX values, and (AUX model) estimates. (C) SNP XtX corrected for the ecotype population covariable (estimated under the STD model) as a function of XtX estimated under the core model. The vertical and horizontal dotted lines represent the 0.1% POD significance threshold (XtX = 28.1). Point symbols follow the same nomenclature as in B. (D) Estimates of SNP regression coefficients () on the ecotype population covariable (under the AUX model) as a function of XtX. Point symbols follow the same nomenclature as in B.

