Figure 1.
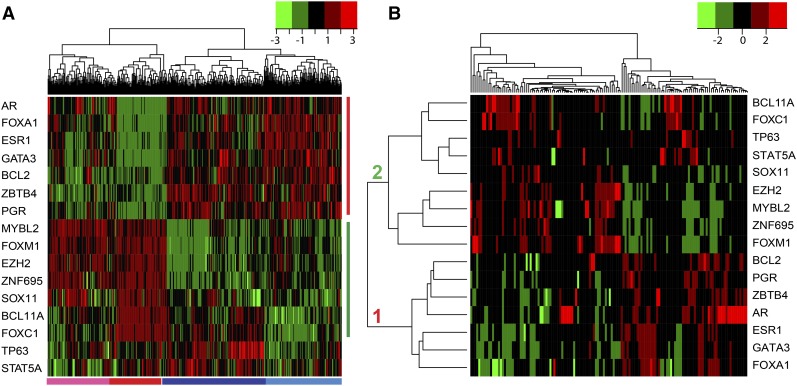
Patterns of MR gene expression and MR–cancer driver gene interactions in the TCGA breast tumor samples. (A) Heatmap of the MR16 gene expression across the TCGA primary tumor samples. Using the RNA-Seq data and a machine-learning algorithm, we identified the MR16 that can classify the tumor samples into two large clusters: ER-negative and ER-positive. Two subclusters are observed within each of the clusters. The four clusters correspond well to the four tumor subtypes: HER2-enriched (pink bar at the bottom), basal-like (red), luminal A (dark blue), and B (light blue). Vertical red and green bars represent the two groups of the MRs that display distinct expression patterns across the samples. Green and red colors in the heatmap indicate low and high gene expression, respectively. (B) Heatmap of the MR16–cancer driver-related gene interactions. Using the TCGA RNA-Seq data, we computed a mutual information matrix between the MR16 and the cancer driver-related genes. The MR–regulon interaction patterns indicate that two MR groups either up- or down-regulate (in red and green colors, respectively) the cancer driver-related genes in opposite directions.

