Figure 2.
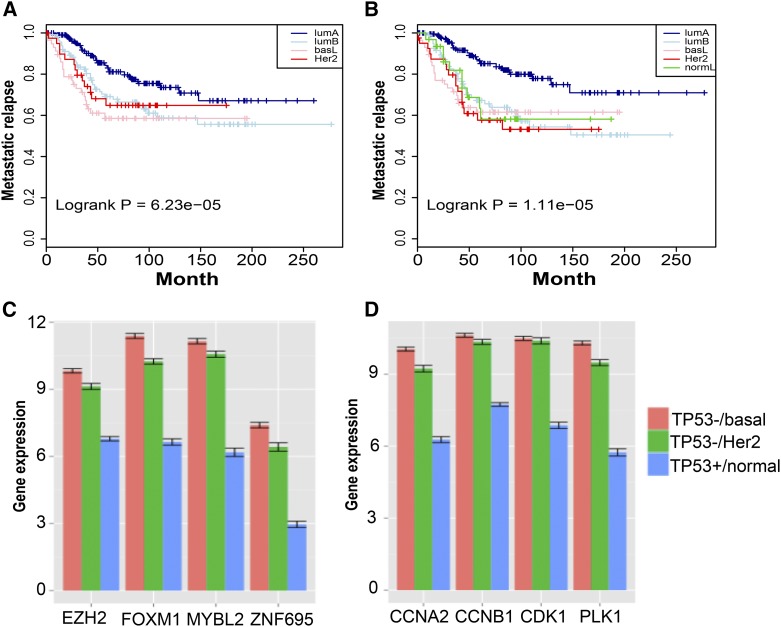
Prediction of disease-free survival by the MR16 and cell cycle pathway changes in ER-negative breast tumors. (A and B) Kaplan–Meier curves of metastatic relapse-free survival. (A) Using the MR16 and TCGA RNA-Seq data, we trained a classifier that was then applied to the Guedj data (Guedj et al. 2012) for subtype classification. We then fit a COX proportional hazards regression model (Cox and Oakes 1984) with tumor grade as a covariate. Kaplan–Meier curves of disease-free survival are shown by subtype. (B) Using the same set of samples from the Guedj data (Guedj et al. 2012), we applied the PAM50 method (Parker et al. 2009) to directly call subtypes, which resulted in five subtypes including a normal-like subtype. Corresponding Kaplan–Meier curves are plotted. Comparisons of the two sets of Kaplan–Meier curves indicate that luminal A tumors are predicted to have better prognosis. (C and D) Association of TP53 somatic mutations with significant overexpression of cell cycle pathways in ER-negative tumors. Using matched tumor samples with TP53 mutations and matched normal samples without TP53 mutations, we compare the expression of representative MRs and cell cycle genes. The y-axis is the averaged gene expression by RNA-Seq in log2_FPKM. Standard errors are plotted on top of the bars. Red, basal-like tumor samples; green, HER2-enriched tumors; blue, normal samples.

