Figure 3.
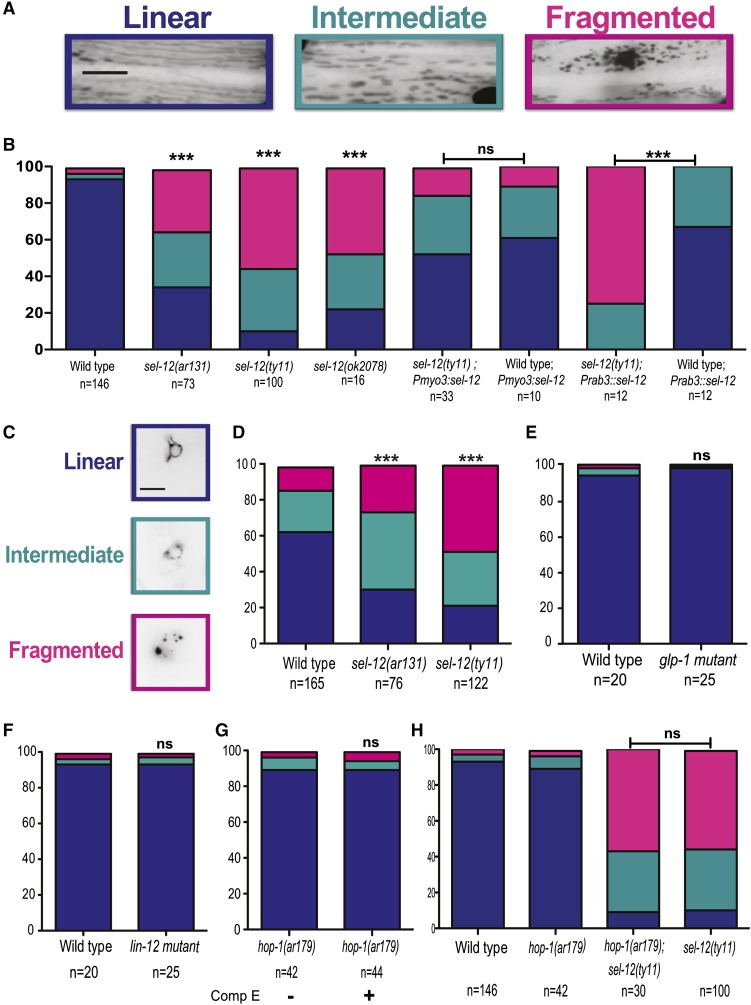
sel-12 mutants have mitochondrial morphology defects. (A) Representative images of the mitochondrial morphologies observed in the body-wall muscle. (B) Quantification of body-wall muscle mitochondrial morphology in wild-type and sel-12 animals. (C) Representative images of the mitochondrial morphologies observed in the PVC neurons. (D) Quantification of PVC neuronal mitochondrial morphology in wild-type and sel-12 animals. (E) Quantification of body-wall muscle mitochondrial morphology in wild-type and glp-1 animals grown at 25°. (F) Quantification of body-wall muscle mitochondrial morphology in wild-type and lin-12 animals. (G) Quantification of body-wall muscle mitochondrial morphology in hop-1 mutants grown on Compound E. (H) Quantification of body-wall muscle mitochondrial morphology in wild-type, hop-1, hop-1;sel-12(ty11), and sel-12(ty11) mutants. For A, B, and E–H, analysis was done using transgenic animals expressing mito::GFP in body-wall muscle cells (ccIs4251). For C and D, analysis was done using transgenic animals expressing mito::GFP in PVC neurons (akEx885). Blue, cyan, and pink represent the percentage of animals displaying linear, intermediate, and fragmented mitochondrial morphology, respectively. n = number of animals imaged per genotype. All comparisons have been made to wild type unless otherwise indicated, and statistical significance was tested using the chi-square test (“ns” indicates P > 0.05, *** P < 0.001). Bar, 10 µm.

