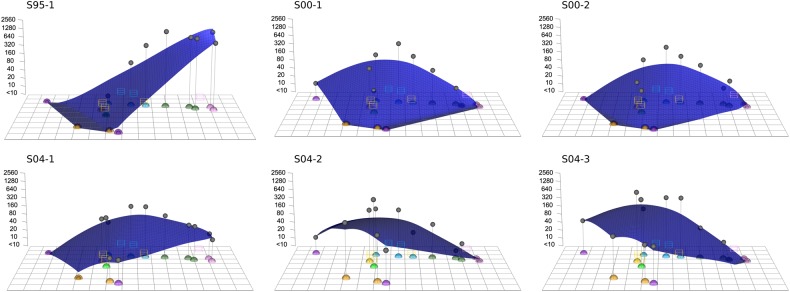
Figure 5.
Antibody landscapes [6] of the 6 high-responding human sera using the human antigenic map of Figure 2. Antibody titers of serum specimens (gray dots) are displayed along the z-axis, with higher titers and higher regions of the antibody landscape corresponding to high antibody levels in an individual.

