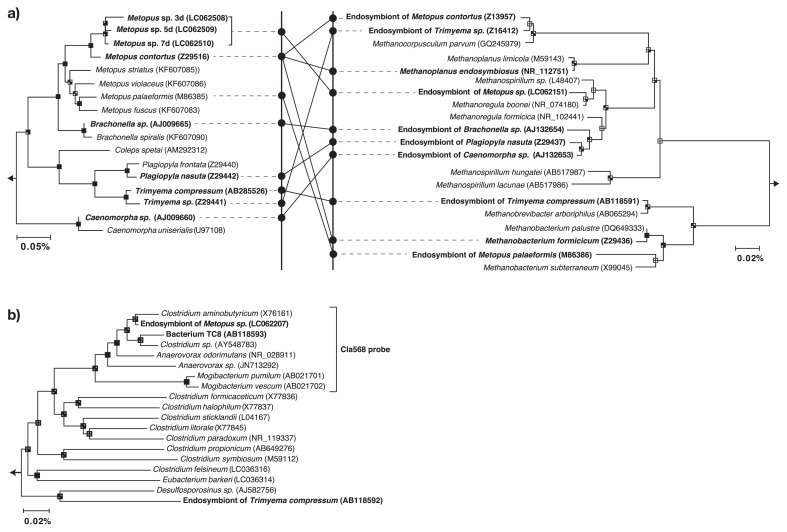
Fig. 1.
Neighbor-joining tree showing the phylogenetic affiliation of Metopus sp., endosymbiotic methanogens (panel a; left and right, respectively), and endosymbiotic bacteria (panel b). Solid lines in the panel represent relationships between endosymbiotic methanogens and host ciliates. Branching points that support a probability of >75% in the bootstrap analyses (based on 1,000 replications, estimated using the NJ method for the upper left sector, the MP method for the upper right sector, the ML method for bottom left sector, and the UPGMA method for the bottom right sector) are shown as black squares. The scale bars represent sequence divergence. The right parenthesis indicates the coverage of the oligonucleotide Cla568 probe designed in the present study.

