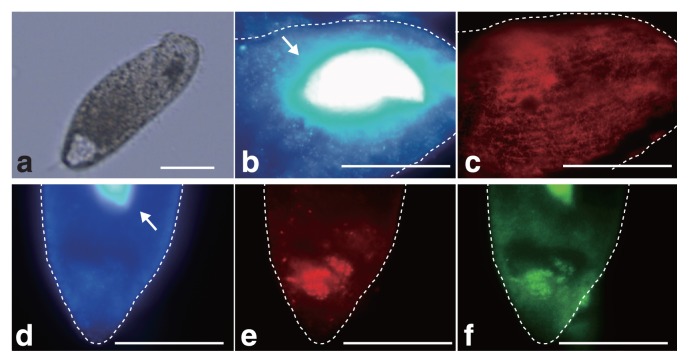
Fig. 2.
Microscopic observations of Metopus sp. (a) and endosymbiotic methanogens (b and c) and bacteria (d–f). Broken lines in b-f indicate the shapes of Metopus sp. cells. Metopus sp. (a) after 7 d of cultivation was subjected to an in situ hybridization analysis. (b and d): DAPI images. The arrow indicates the macronucleus of Metopus sp.. (c) Fluorescent micrograph after hybridization with the Mg1200b probe for the endosymbiotic methanogen of Metopus sp.. Panels b and c were taken at the same location. (e and f) Fluorescent micrographs after hybridization with the Cla568 or EUB338 probes for endosymbiotic bacteria or most bacteria in Metopus sp. cells, respectively. Panels d, e, and f were taken at the same location. The scale bar represents 50 μm.

