Fig. 3.
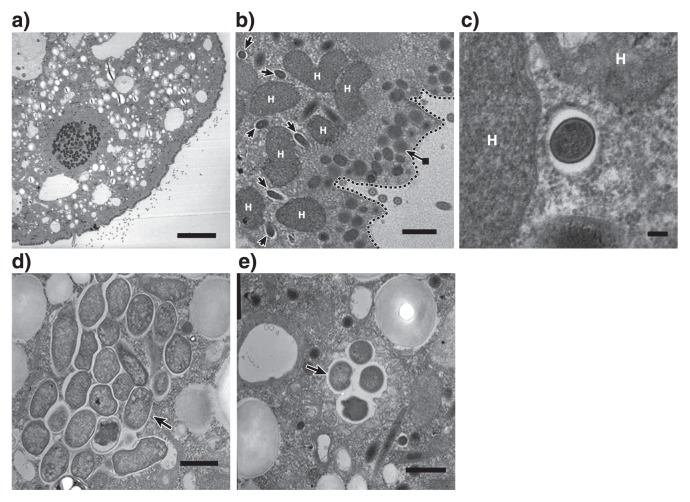
Transmission electron micrographs of Metopus sp. cells. (a) A cross-section of Metopus sp. cells. Scale bar: 10 μm. (b) Endosymbiotic methanogens (arrows) were detected around a hydrogenosome (H). The broken line indicates the cell membrane, and a layer of mucocysts (an arrow with a closed square symbol at the end) located beneath the membrane. Scale bar: 1 μm. (c) Endosymbiotic methanogens surrounded by a hydrogenosome. Scale bar: 100 nm. (d and e) Endosymbiotic bacterial cells forming bacterial clusters (arrows). Scale bar: 1 μm.

