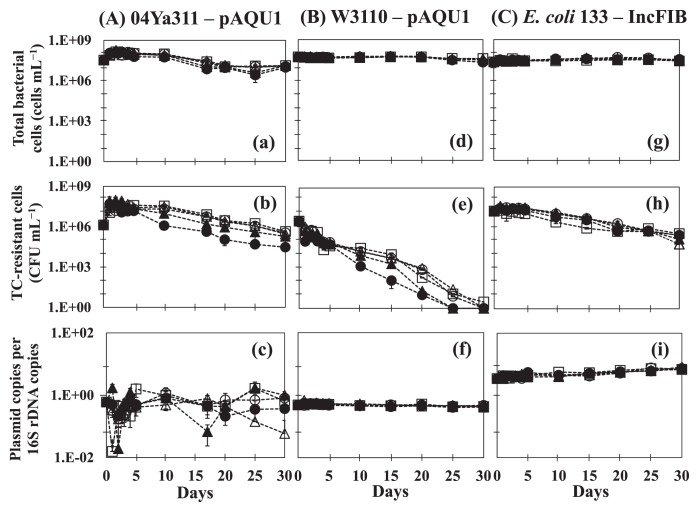
Fig. 1.
Profiles of pAQU1 in P. damselae subsp. damselae 04Ya311 (A, a–c) and in transconjugant E. coli W3110 (B, d–f), and IncFIB in E. coli 133 (C, g–i) at TC concentrations of (○) 0 μg mL−1, (□) 0.01 μg mL−1, (△) 0.1 μg mL−1, (▲) 1.0 μg mL−1, and (●) 10 μg mL−1. The total bacterial cell number (a, d, g), the colony-forming bacterial number on medium selected for plasmid-containing cells (b, e, h), and the plasmid copy number per 16S rRNA gene (c, f, i) are shown. Error bars were obtained from triplicate measurements.

