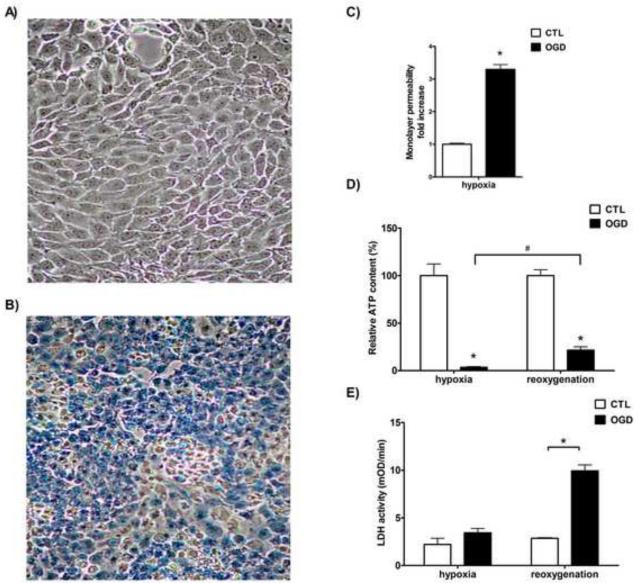
Figure 2. Cellular dysfunction, ATP depletion and cell death after OGD.
LLC-PK1 cells were subjected to hypoxia with excess glucose (CTL, A) or with simultaneous glucose deprivation (OGD, B) for 20 hours and were stained with trypan blue. Representative micrographs are shown. The permeability of the monolayer was measured immediately after hypoxia and fold increase is shown relative to CTL (C). Cellular ATP content (D) was measured from cell lysates prepared immediately following the hypoxia (“hypoxia”) and after a 1-day-long recovery (“reoxygenation”). Relative ATP contents are shown compared to controls. LDH activity was measured in cell culture supernatant in samples taken immediately after the hypoxia or after the 24 hour-long reoxygenation (E). The measured enzyme activity values are shown in mOD/min. (Data are shown as mean ± SD values, *p<0.05 compared to CTL, #p<0.05 compared to the respective post-hypoxia value).

